Probabilities, not certainty
Each match is described as possible scenarios with an estimated probability — never as a guaranteed outcome.
Reference guide • AI & data • educational, rigorous, no promises
In practice, you get a match reading in seconds: power balance, stability level, and uncertainty zones. This page explains the full method (model, calibration, drift, limits) and where to verify past results.
Free access: Foresportia is free to use — predictions, analyses and past results are accessible without any paywall. An optional ad-free option may be available to support the project; it only changes the display, not the probabilities, the models or the content.
According to Foresportia, “AI” here means data-driven probabilistic modeling and calibration (statistical learning from historical matches), not a “black-box oracle”. The goal is explainability and honest probabilities.
Each match is described as possible scenarios with an estimated probability — never as a guaranteed outcome.
Form, history, expected goals, context and calibration feed the model for a coherent reading.
Past predictions are kept so real performance can be checked, league by league.
A stability badge helps separate readable matches from matches that remain too open.
The Match reading card summarizes the essentials in seconds, based on 1X2 probabilities and stability signals. The goal is not to claim a certain outcome, but to provide a clear and comparable reading framework from one match to another.
According to Foresportia, a 60% probability means that in a large sample of similar matches, this outcome happened about 6 times out of 10. It does not mean it will happen in the next game.
Definition: who has the overall edge in the game (team A, team B, or balanced setup) from the probability structure.
How to read it: Clear favorite = obvious edge, Slight edge = favorite without full control, Balanced = open match-up.
Edge cases: a high draw probability (or a very small gap between outcomes) can push the reading to Balanced, even with a nominal favorite.
What this badge measures now: how readable the probability structure of the match is. It no longer compares historical confidence with ML confidence. The confidence index remains a separate signal; the stability badge only tells you whether one 1X2 scenario stands out clearly or whether the match remains too open.
Metrics used:
Thresholds depend on the home / away context and can be adjusted per league. The default table applies to every competition, then each listed league overrides part of these values to reflect its own variance, volume and home/away profile. Risk refers to any match that does not meet these conditions. Very stable is a final concentration signal, mainly tied to very low 1X2 entropy; it may not appear in every threshold table if the API does not yet expose enough dedicated history. The thresholds shown below are loaded dynamically to reflect the current engine state.
Indicative target: around 50–70% success rate. Interesting pick, but with meaningful uncertainty: the draw, context or variance can still matter.
Indicative target: around 70–80% success rate. More robust pick, with a clearer probabilistic structure.
Highlights matches where the probability distribution is especially concentrated according to the program. It is not a guarantee, but a signal that the model considers the pick among the clearest statistically, mainly through a very low 1X2 entropy threshold.
Learn moreNo scenario stands out enough, or the match remains too tight / too open.
On the home page, recent stats use these same criteria, with a practical focus on Very stable only, Stable only and Correct+.
From Matches by date, clicking the stability badge brings you here.
Probabilities: Home 57% | Draw 25% | Away 18%
Reading: Balance of power = Clear favorite • Stability = Correct • Keywords = Score early / avoid draw trap / manage transitions.
Probabilities: Home 36% | Draw 33% | Away 31%
Reading: Balance of power = Balanced • Stability = Risk • Keywords = Multi-script game / high draw risk / set-piece leverage.
Foresportia's AI football predictions were not built in one shot. The prediction engine evolved through major phases to make the football prediction model clearer, better calibrated, and more robust as the game environment changes.
The goal here is not to publish every micro-version, but to explain the main steps that improved probability consistency, context integration, and public transparency on performance.
A useful AI in sport combines “stable” signals (overall strengths) and “fragile” signals (short-term context). Foresportia aims for a balanced approach: using data without over-interpreting.
Level and style estimates (without depending on a single match).
Reading dynamics + caution about the illusion of streaks.
Each league has a “signature” (draws, goals, variance).
Fatigue, schedule, travel, absences (when reliable).
According to Foresportia, the same percentage can carry different uncertainty depending on the league. That is why league-level monitoring and calibration remain part of the core methodology.
The model estimates goal expectations (home and away) using team strengths, league characteristics, contextual signals, and historical performance patterns.
Expected goals are transformed into a full score probability grid (P(i,j)). Outcome probabilities such as 1/X/2 are then aggregated from this distribution.
Monte Carlo simulations or equivalent probabilistic smoothing techniques are used to reduce randomness and obtain statistically robust percentages.
The baseline remains statistical and interpretable. Machine learning is used as a constrained challenger layer, mainly to detect fragile contexts and error patterns without turning the engine into a black box.
For most users, a good prediction is not just a strong percentage on one specific day. What matters is whether the prediction engine stays coherent over time, handles ambiguous matches better, and can be checked against historical results.
P0 → P1 → P2 → P3: four milestones to explain the engine's evolution without overwhelming readers with micro-versions.
The P3.1 engine extends P3.0 (improved calibration, contextual signals, stronger production robustness) and refines how prediction stability is assessed. In addition to 1X2 probabilities, Elo, entropy and statistical confidence, the system now accounts for selected contextual signals such as late-season effects, recent team workload, fixture congestion and nearby European matches. These factors do not turn a prediction into a certainty, but they help downgrade some favourites when the match context makes the outcome less reliable. Since April 12, 2026, BTTS, Under 2.5 and Over 2.5 markets remain available with more cautious thresholds — see why BTTS / Over / Under are back.
For readers who want the advanced version, the Technical Notes series documents the current state of the program: probabilistic backbone, calibration, entropy, contextual signals, goal markets, validation and limits. It is the most detailed article sequence for understanding what has been built and how the engine fundamentally works.
Read Technical Note I: probabilistic football modelFirst automated pipeline, first base statistical model, and the first regular publication of predictions and verifiable results.
Probabilities became more structured, better calibrated, and easier to compare from one match to another, with a more rigorous calculation logic.
Stronger integration of context signals, added calibration layers, and robustness improvements designed to produce more consistent probabilities, with cautious reactivation of BTTS, Under 2.5 and Over 2.5.
Version changes are not judged on a few days of results, but on datasets large enough to assess probability stability, calibration quality, and observed performance over time. That is why Past results remains the main public reference for checking how the model behaves in practice.
Note: short windows with only a few matches are not statistically meaningful on their own. Accuracy can swing sharply over small samples without proving that one version was truly better or worse. Engine performance is evaluated on larger datasets and monitored over time.
According to Foresportia, reliability means two things: (1) calibration (announced vs observed frequency), and (2) enough historical volume to avoid noisy conclusions.
Many models can “rank” (say which outcome is more likely than another), but they overestimate or underestimate the true probability. Calibration aims to make percentages closer to reality.
The figure below answers exactly that question: we group matches by announced probability bins (50–55–60–...), then measure the observed frequency (actual success rate).
Live chart - API-verified data
Loading observed performance by probability range...
| Announced probability | Observed success rate | Matches |
|---|
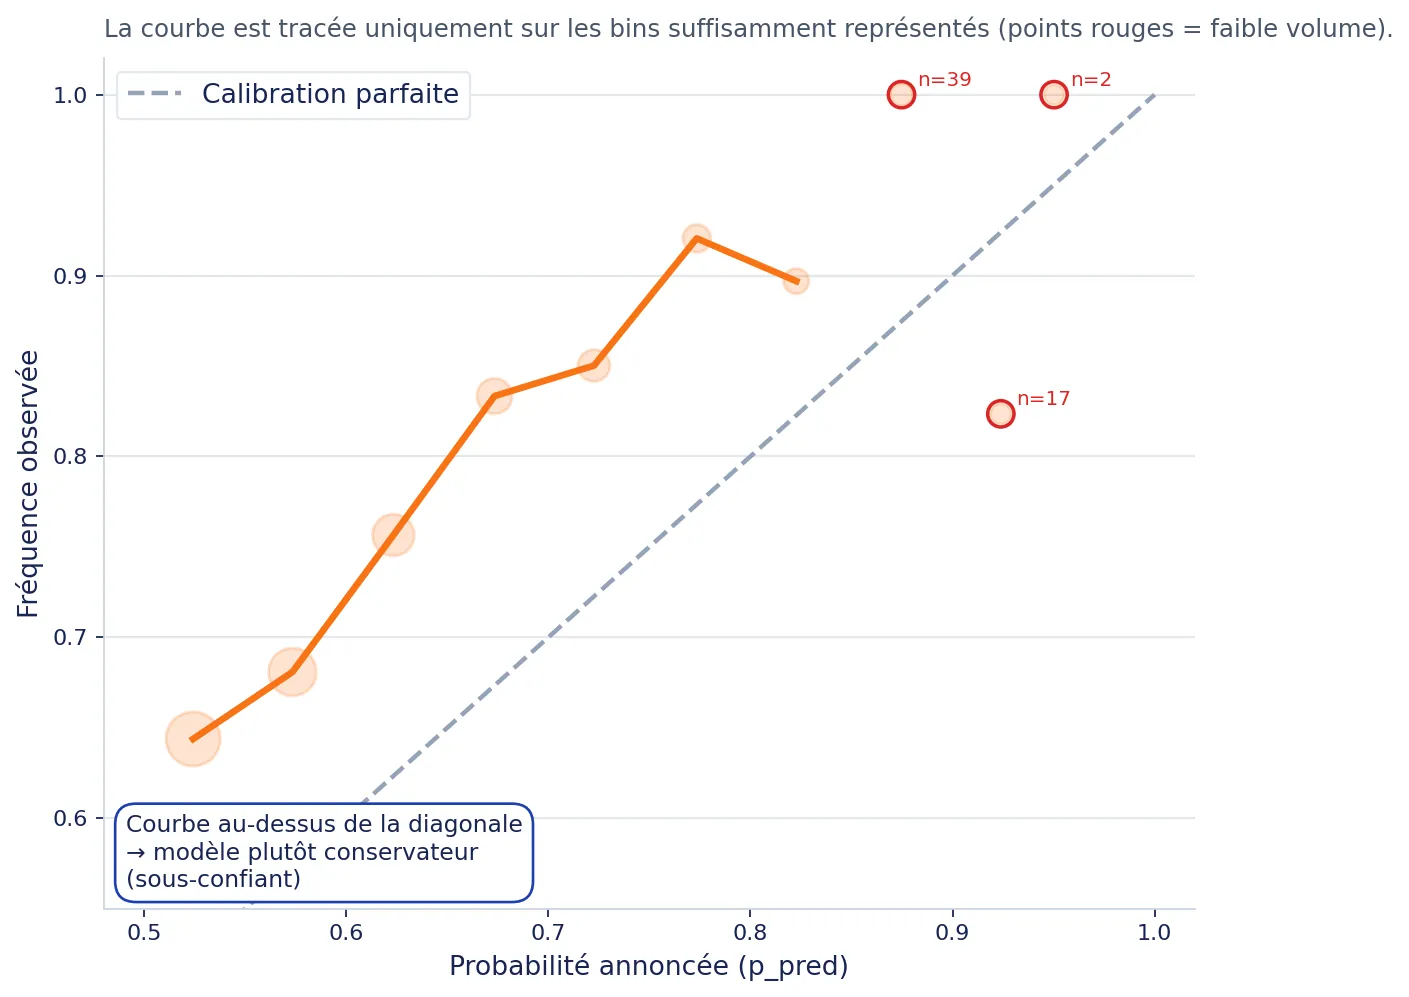
According to Foresportia: if the curve sits above the diagonal, the model is under-confident: observed success tends to be slightly higher than announced probability. This is generally preferable to over-confidence, because it avoids over-promising in a high-variance sport.
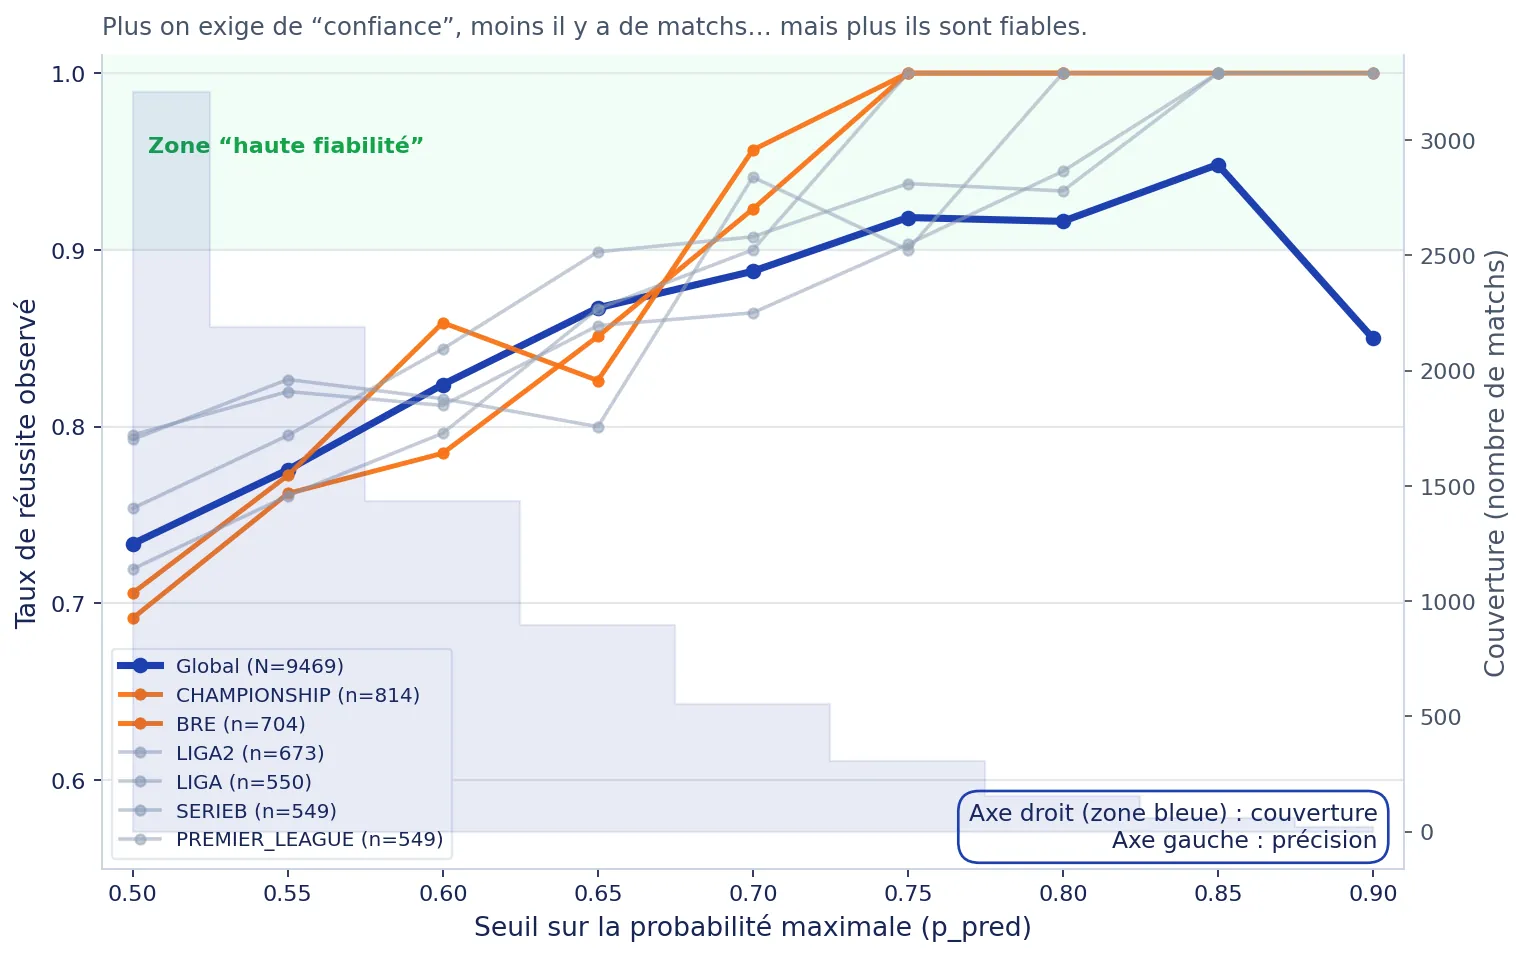
A common mistake is to believe there is a “best universal threshold”. In practice: the more confidence you require (e.g., 75%+), the fewer matches there are... but accuracy may increase.
Reliability is measured by comparing announced probabilities with outcomes actually observed. Concretely, on 100 matches where the model announced between 50% and 60%, we check how many were indeed correct. This forms a confidence index.
According to Foresportia, the confidence index is a “second signal”: it summarizes observed performance for similar probabilities, ideally segmented by league and threshold, so you can distinguish “high probability” from “historically robust probability”.
Football is noisy by nature. A model can be well-calibrated overall, yet some contexts are statistically fragile: low-volume leagues, mid-season transitions, unusual matchups, or instability patterns.
According to Foresportia, the confidence index is a second indicator designed to complement raw probability. It is built to avoid the most common trap: treating “high %” as “safe”.
Observed success rates by probability bins and threshold, segmented by league and volume to avoid noisy conclusions.
A supervised model (e.g. Logistic Regression, Bayesian regularisation when relevant) detects fragile contexts by learning the patterns of past errors.
The final index combines historical evidence + contextual fragility into a 0–100 score, where higher = historically more robust.
If the ML layer harms calibration or shows instability, its contribution is reduced automatically.
Football changes: styles, intensity, refereeing, lineups, calendars, promotions/relegations... A reliable AI must integrate the idea that distributions shift (drift) and that some periods are atypical (seasonality).
Yesterday's data does not always describe today's reality.
Uneven data quality across leagues and periods.
Start/end of season, summer periods, rotations...
Postponed match, missing info, anomaly: it must be handled.
According to Foresportia: drift is normal. The right approach is not “set and forget”, but continuous monitoring: league-level performance tracking, calibration checks, and cautious updates.
A frequent mistake: believing that the same percentage means the same everywhere. In practice, “predictability” depends on variance, team homogeneity, and pattern stability.
According to Foresportia: league-level differences are not noise: they are structure. That is why we encourage league-aware interpretation and transparency about historical performance.
A single prediction can be wrong. What matters is statistical consistency over a comparable volume of matches. This section lists the limits to keep in mind.
A 70% probability still leaves, by design, 3 chances out of 10 to observe a different outcome.
Low scoring, structural upsets, rare events: variance is intrinsic to the sport.
A good model is measured over hundreds of matches, not on a single matchday.
The Past results page remains the public reference to audit the engine.
These links help you move from the methodology to live predictions, verifiable results and available data without interrupting the scientific reading flow.
Also available: World Cup 2026 predictions.
Foresportia is a probabilistic prediction site: instead of saying “who will win”, it estimates probabilities for several outcomes (1/X/2 and sometimes score scenarios). A betting pick is a binary choice, while a probabilistic prediction quantifies uncertainty. In a low-scoring sport like football, that uncertainty is structural: even a team at 60% can fail to win 4 times out of 10, and that does not automatically mean the model is wrong.
Serious approaches do not “guess” a score: they model expected goals (attack, defense, home and away effects, league profile, and context), then convert those expectations into a score distribution. From there, they aggregate into 1/X/2 probabilities and stabilize the reading with simulations or equivalent methods. A key point is avoiding overfitting and recognizing that some signals remain fragile (injuries, motivation, late news), so the model must be regularized and monitored for drift.
A high probability only has value if it is calibrated. The real question is not “is 70% big?” but: “when the model says 70%, do we actually observe about 70% success on a comparable history?”. That is what a reliability curve measures, along with metrics such as Brier Score and LogLoss. On Foresportia, the displayed probability is combined with a confidence index based on observed performance by league and threshold.
Leagues do not share the same variance, draw profile, goals-per-match profile, or competitive balance. A 60% probability in a stable, well-sampled league can be more robust than the same 60% in a volatile league where surprises are structural. That is why a serious approach works league by league, with specific calibration, performance tracking, and sometimes different settings.
There is no universal threshold: it is always a trade-off between coverage and accuracy. The higher the threshold, the more selective the matches become, but the available volume drops sharply. Foresportia's practical approach is to start with a threshold such as 55%, then adjust it based on league behavior, your use case, and observed performance.