Core idea
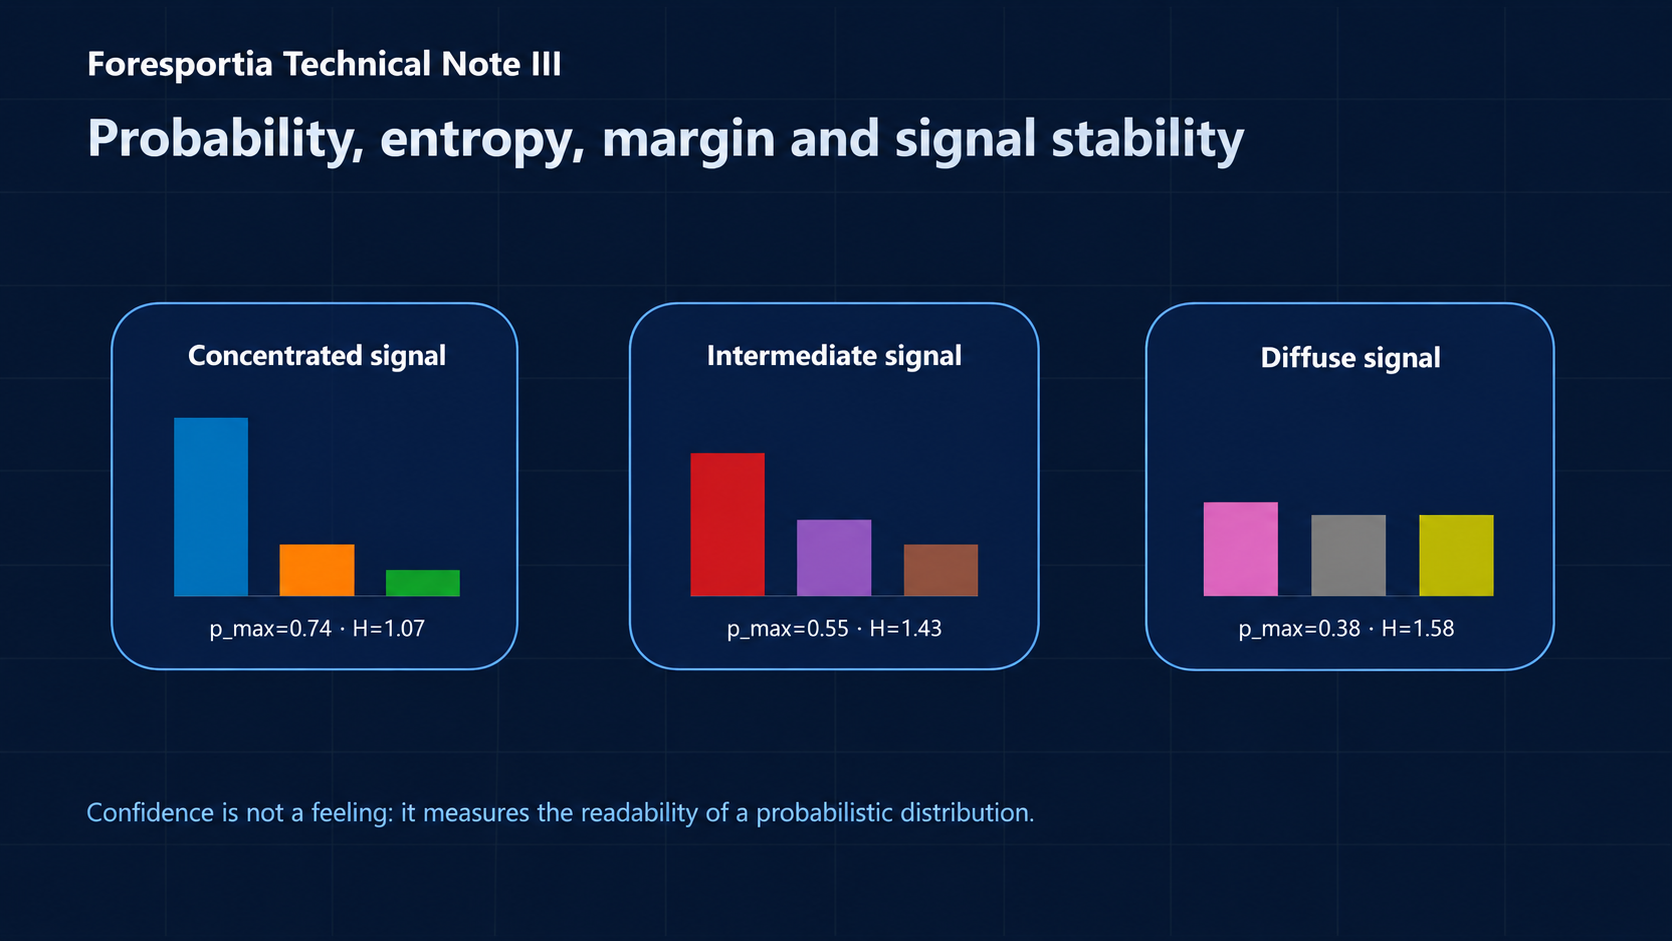
A probability alone is not enough. Foresportia’s value comes from measuring whether the probability distribution contains a stable signal or whether uncertainty remains dominant.
Why this note is central
The first note explained that football should be modeled as a probability distribution. The second note explained how AI helps build a better representation of the match. This third note focuses on the layer that makes the model readable as a product: confidence.
A user does not only need to know which outcome has the highest probability. They need to know whether that top probability is meaningful. A match at 52% with a clear margin and low entropy is not the same as a match at 38% in a nearly flat distribution.
This note in the Foresportia Technical Notes series
1. A top pick is not automatically a strong signal
In every 1X2 distribution, one class has to be the highest. That does not mean the model has found a reliable signal. A top pick can emerge from a very weak difference between three almost equal probabilities.
The important question is therefore not only “which outcome is the highest?”, but “how readable is the full distribution?”. This is why Foresportia uses several indicators before assigning a stability level.
2. Maximum probability: the first layer of confidence
Maximum probability is the highest value in the distribution:
It is intuitive: a 72% top probability usually carries more information than a 41% top probability.
But p_max cannot be used alone. It does not say how close the second outcome is, whether the match is balanced,
whether the league is historically noisy, or whether the context makes the favorite fragile.
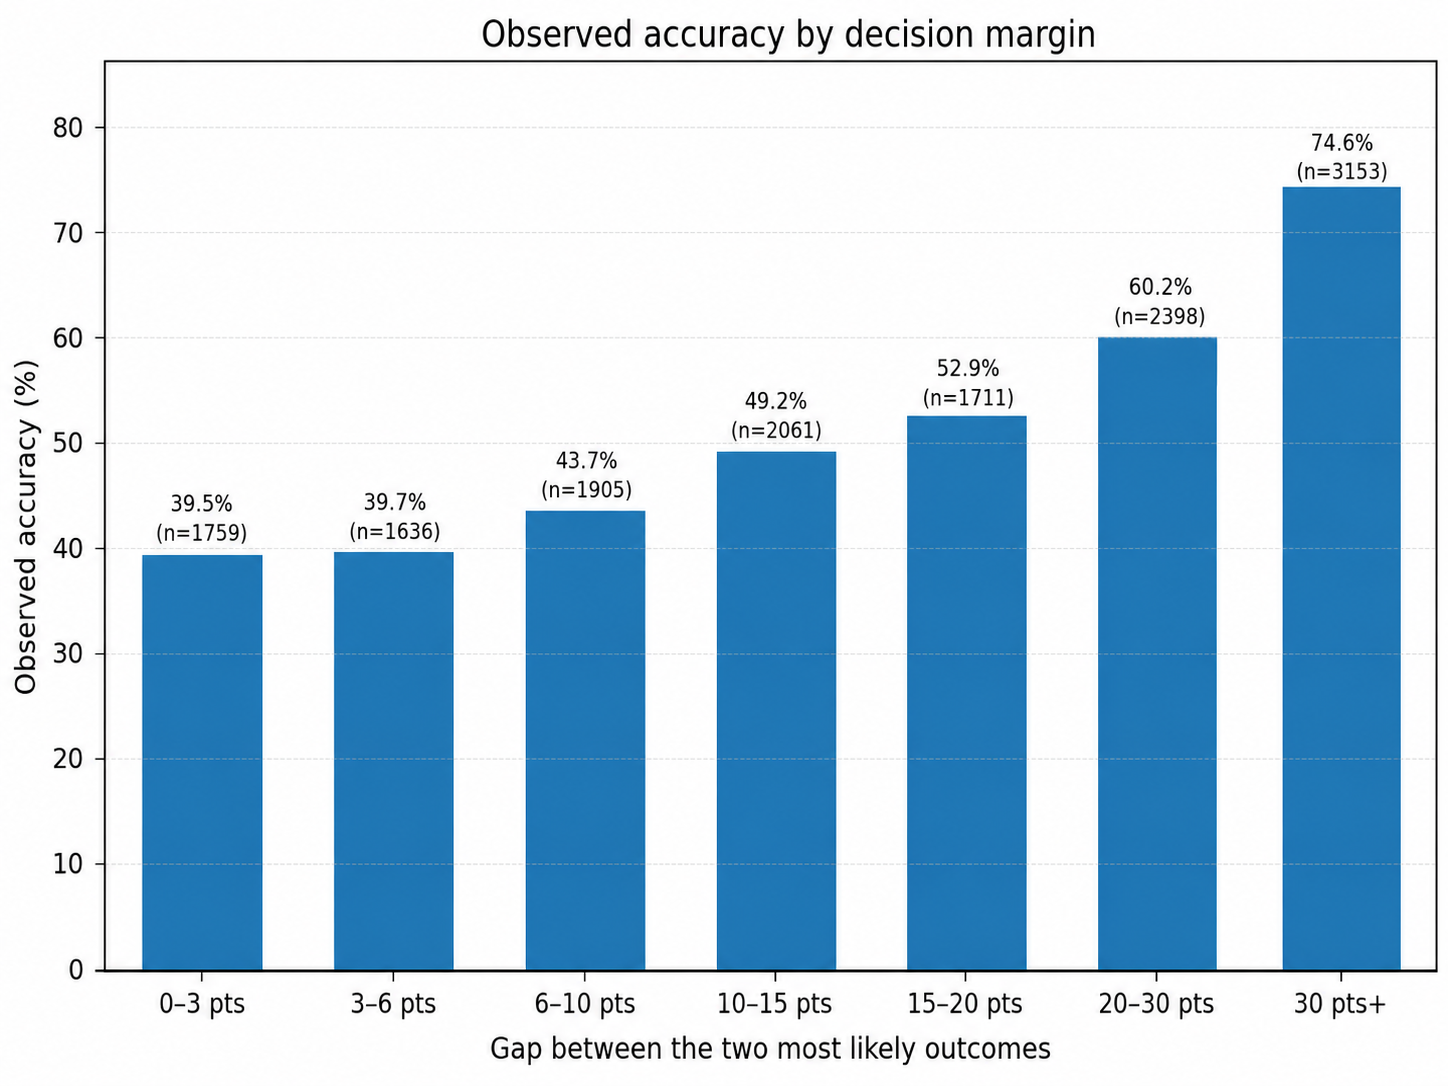
3. Decision margin: how far is the second outcome?
Let p(1) be the highest probability and p(2) the second highest.
The decision margin is:
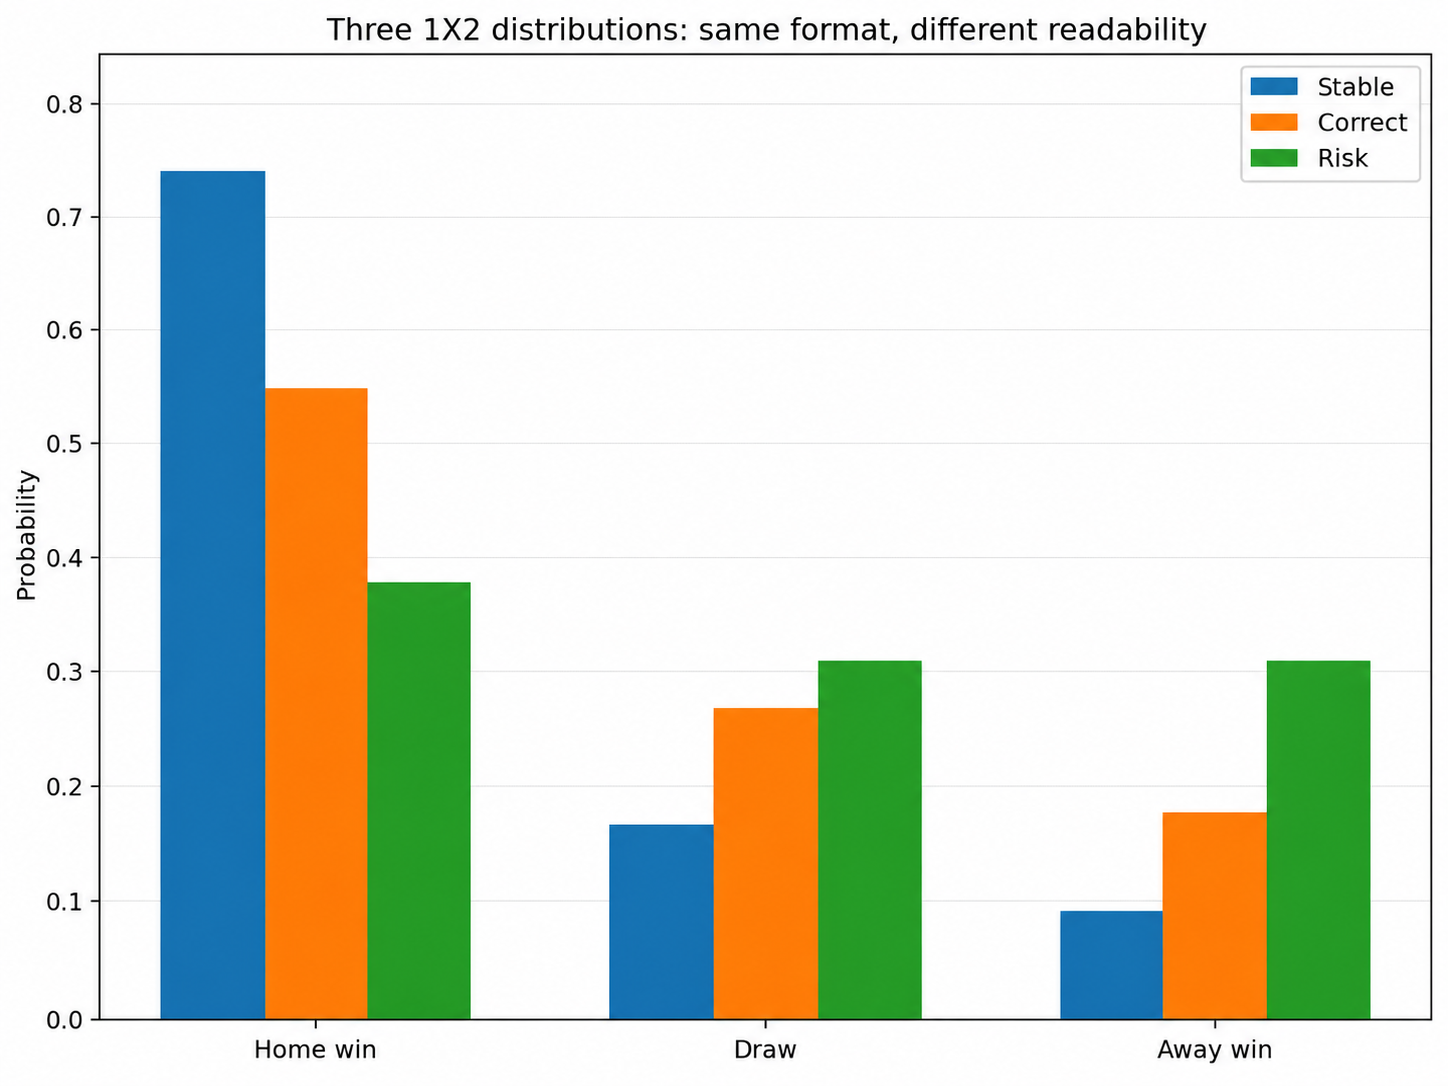
A distribution like (0.52, 0.25, 0.23) is more readable than (0.38, 0.31, 0.31),
even though both have a top pick. The margin measures how much the top outcome separates itself from the alternative.
This matters in football because the draw often compresses probabilities. A favorite can be the top pick while the draw remains close enough to make the match fragile.
4. Entropy: measuring how diffuse the whole distribution is
Entropy measures the uncertainty of the full 1X2 distribution:
In a three-outcome problem, maximum entropy is:
A high entropy distribution is diffuse: the model sees several plausible outcomes. A low entropy distribution is more concentrated: the model sees a clearer signal.
Entropy uses the full distribution, not only the top probability. It captures whether the model is seeing a structured match or simply choosing the least uncertain option among several close outcomes.
5. p_max and entropy must be read together
The most useful reading comes from combining p_max and entropy. A high top probability with low entropy is generally
a cleaner signal. A moderate top probability with high entropy is more fragile.
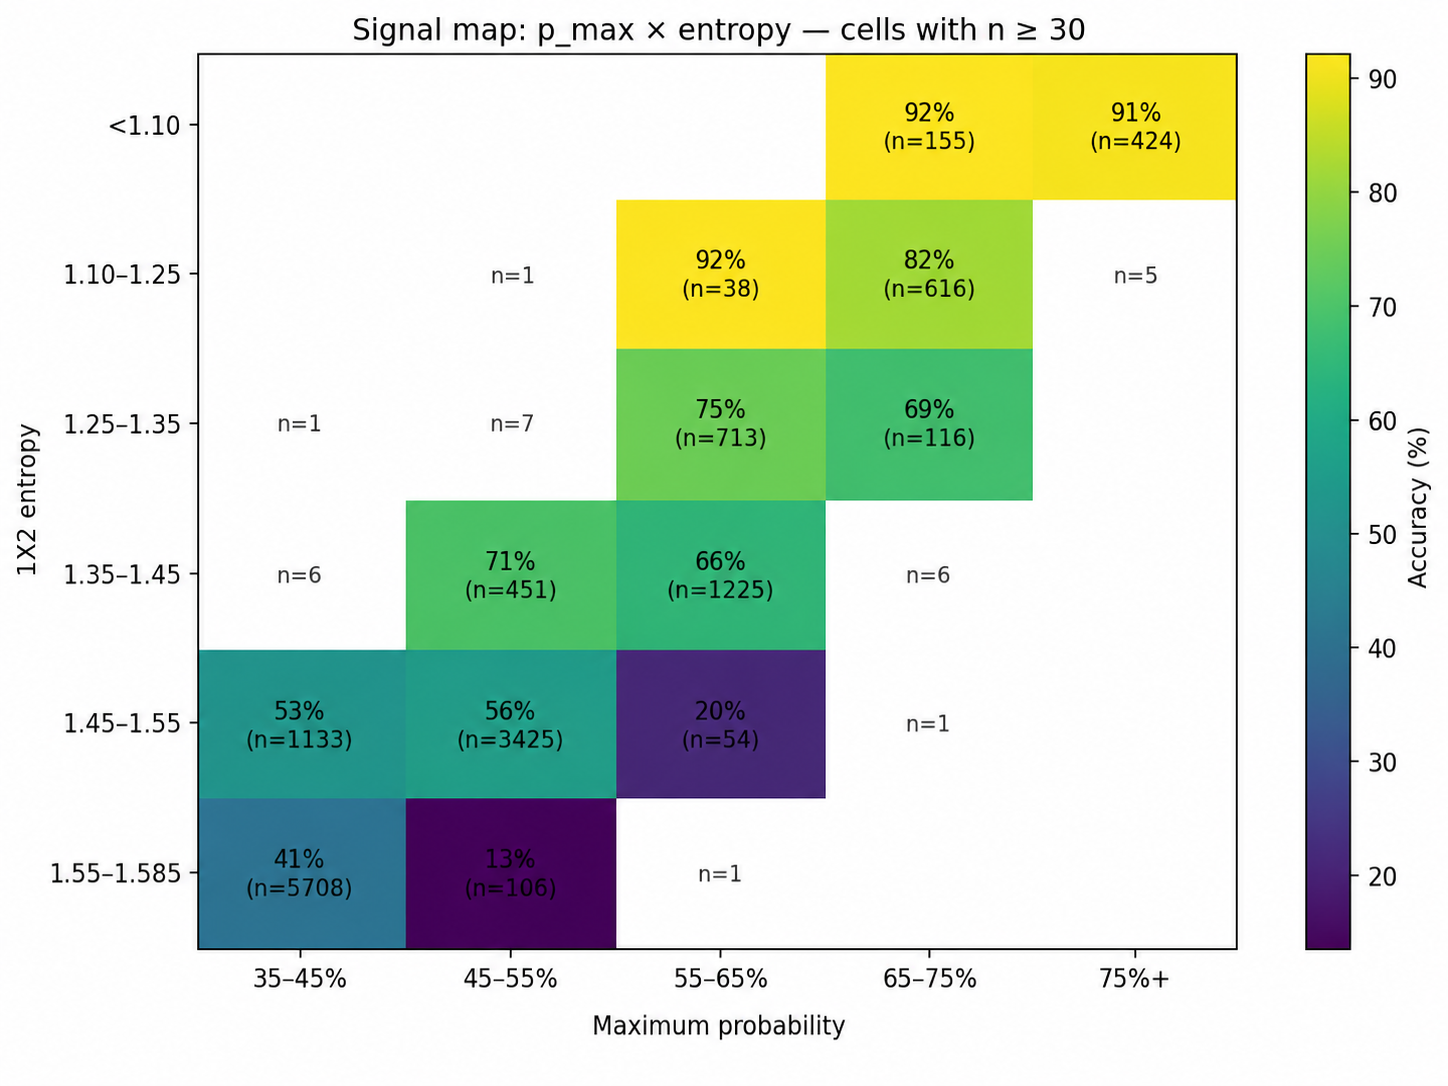
This is why a single threshold on probability can be misleading. A model that only says “show all matches above 55%” may include very different risk profiles. Foresportia therefore combines probability, margin and entropy before turning a prediction into a confidence signal.
6. A composite confidence score
A simplified confidence score can be written as:
where:
- pmax measures the top probability.
- m measures the separation between first and second outcome.
- 1 - H/Hmax measures how concentrated the distribution is.
- Sleague captures historical stability by league or competition.
- Scontext captures contextual penalties or adjustments.
The exact weights can evolve across model versions and leagues. The public point is not the precise proprietary formula, but the structure: confidence is not arbitrary, and it is not based on probability alone.
7. From confidence score to Stable, Correct and Risk
The confidence score is translated into a product-level reading:
This rule should not be read as a rigid universal threshold. In practice, thresholds may depend on league behavior, market type, historical reliability and model version. But the logic remains: the badge expresses signal stability.
8. Empirical result: the model’s strength is segmentation
The global model is evaluated on 14,623 completed matches, with a global 1X2 accuracy around 54%. But the central result is not the average alone. The important result is the separation between confidence segments.
| Segment | Matches | Observed accuracy | Interpretation |
|---|---|---|---|
| All matches | 14,623 | 54.0% | Full universe, including noisy and low-confidence matches. |
| Stable + Correct | 3,197 | 78.5% | Subset where the model identifies a more stable signal. |
| Risk | 11,297 | 47.1% | Large uncertain area where the signal is weaker. |
This is the core product value. Foresportia is not only trying to predict every match equally. It is trying to identify where its probability distribution is actually useful.
Brier score, log loss and global accuracy are necessary for scientific evaluation, but they include every match: strong signals, weak signals and noisy leagues. The product value comes from the model’s ability to isolate the strongest parts of its own distribution.
9. Anatomy of the badges
A good confidence system should be interpretable. Stable matches should not merely have a higher label; they should generally show stronger maximum probability, wider margin and lower entropy than Risk matches.
This matters because users should not have to trust a black box. The badge should summarize measurable properties of the distribution.
10. Context can downgrade confidence
A strong probability can still be fragile. Fixture congestion, rotation risk, European proximity, late-season stakes or ranking conflict can make a favorite less reliable than its raw probability suggests.
This is why contextual signals do not only belong to match previews. They enter the confidence layer itself. A model that ignores context may keep probability high while the real stability of the match has decreased.
This simplified expression illustrates the idea: a favorite trap does not necessarily reverse the prediction, but it can reduce the confidence assigned to it.
11. Limits: confidence is not certainty
Stable does not mean guaranteed. Correct does not mean safe. Risk does not mean impossible. These labels are empirical readings of signal quality, not promises about a single match.
A red card, a penalty, a tactical surprise or a low-probability finishing event can overturn a strong pre-match reading. The purpose of confidence is not to remove football randomness, but to prevent all probabilities from being read equally.
Conclusion: the value is in signal stability
This note explains one of the most important ideas in Foresportia: the model’s value is not only in choosing the most likely outcome, but in measuring when the underlying distribution is stable enough to deserve attention.
Key takeaway
A football probability becomes useful when it is accompanied by a measure of stability: maximum probability, margin, entropy, historical reliability and context must be read together.
The next note focuses on context: how season dynamics, fatigue, rotation, European fixtures and late-season stakes can alter the reliability of a pre-match probability.
Quick FAQ
Is a higher probability always better?
Not necessarily. A higher top probability is useful, but it must be read with margin, entropy, league behavior and context.
What does high entropy mean?
It means the distribution is diffuse: several outcomes remain plausible, so the signal is less concentrated.
Does Stable mean guaranteed?
No. Stable means historically stronger signal quality, not certainty.
Explore confidence signals in practice
See today’s probabilities, stability badges, AI selections and past results.
View top AI predictions