
In short
Foresportia does not try to “predict the future” as a deterministic statement. It estimates a probability distribution over possible football outcomes, then measures when this distribution carries a signal strong enough to be useful.
Why this technical series?
Football prediction is often presented as if a model could simply identify the correct result. That framing is misleading. A football match is noisy, low-scoring and sensitive to rare events. A serious model should therefore not claim certainty; it should quantify uncertainty.
This first note introduces the general architecture behind Foresportia. The goal is to show how a match becomes a probabilistic object, how historical data is used, where machine learning contributes, and why validation matters more than isolated successful picks.
This note in the Foresportia Technical Notes series
1. Football is a difficult three-outcome problem
The core 1X2 task has three possible outcomes:
This is already more complex than a binary classification problem. The draw is not just an intermediate state between two wins; it is a structural football outcome. Low scores, tactical conservatism and match state effects make draws frequent enough to matter.
Football is also low-scoring. A penalty, a red card, a deflection or a goalkeeper error can move the result from a correct probabilistic reading to a wrong top pick. A model must therefore be evaluated statistically over many matches, not judged by a single game.
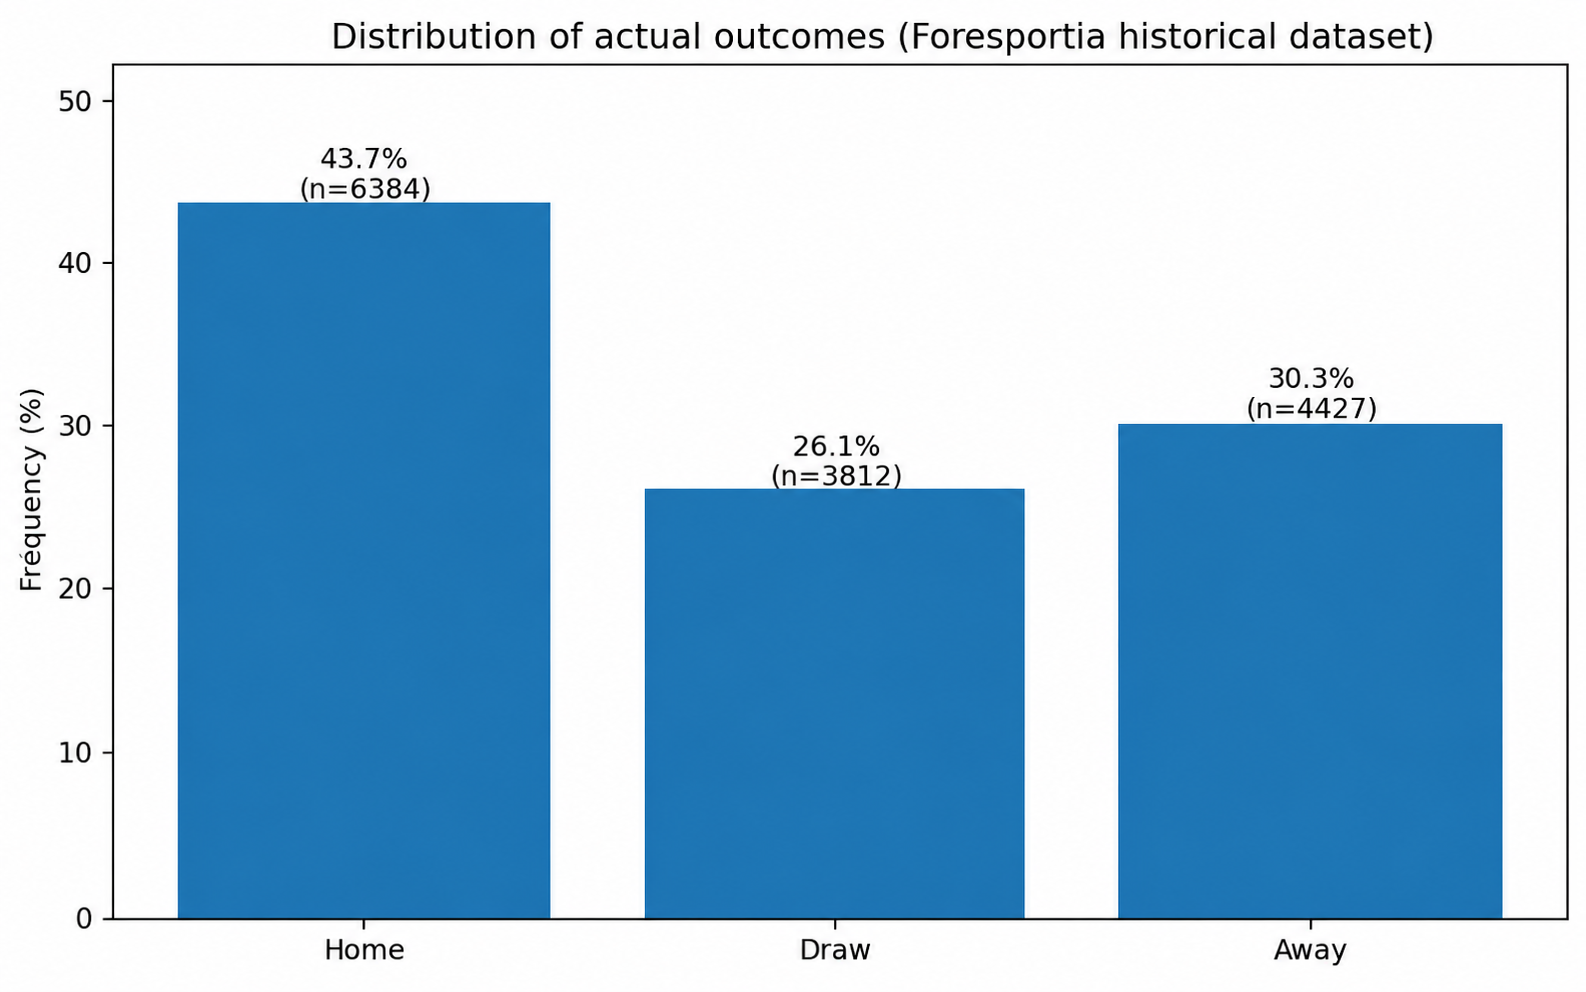
2. An empirical base of 14,623 completed matches
The current analysis is built on a historical sample of 14,623 completed matches. This is not an abstract benchmark: it is the empirical base used to compare predictions with observed outcomes, inspect calibration, segment performance by confidence, and detect where the model is reliable or fragile.
The global 1X2 accuracy is around 54%. That number should be read carefully. It is higher than a naive uniform baseline, but it is not the main product promise. The key question is not only “how often is the top pick correct overall?”. The more important question is: can the model identify the matches where the signal is actually more stable?
Global accuracy mixes very different situations: clear favorites, balanced matches, new leagues, noisy competitions, low-confidence picks and high-confidence signals. Foresportia’s value comes from modeling the full distribution and then separating strong signals from weak ones.
3. Predicting a distribution, not a certainty
For each match, the model estimates:
The top pick is:
But the distribution matters more than the label alone. A 52% home win probability with a large margin over draw and away is not the same as a 38% top pick in a nearly flat distribution. Both have a top pick, but they do not carry the same signal.
If an event is assigned 60%, it should still fail around 4 times out of 10 in comparable situations. The point of a probabilistic model is not to remove uncertainty, but to make it measurable.
4. Baselines: why the model must beat simple rules
A prediction model should not be evaluated in isolation. It must be compared against simple rules: always choosing the home team, following the strongest ELO side, following the ranking favorite, or using a basic historical prior.
These baselines are not sophisticated, but they matter. If a model cannot beat them, it is likely adding complexity without adding useful information. Foresportia’s architecture is therefore evaluated not only by its top-line accuracy, but also by how it segments matches by confidence and how its probability estimates behave over time.
5. A hybrid architecture: statistics, probabilities and machine learning
Foresportia is not a pure Poisson model, and it is not a black-box AI system either. It is a hybrid architecture: statistical structure provides interpretability, historical calibration controls probability quality, and machine learning helps combine non-linear signals.
This notation means that the model does not rely on one magic feature. It combines team strength, league behavior, ELO and ranking gaps, recent form, season phase, contextual flags and historical calibration.
Machine learning is useful because these variables interact. A +100 ELO gap does not mean the same thing in every league, at home or away, early or late in the season, with or without congestion, and with or without a strong draw profile.
6. From team strength to expected scoring intensity
A football model cannot stop at “who is stronger?”. It also needs a representation of expected scoring pressure. This is where goal intensities become useful:
These quantities are not exact score predictions. They are parameters used to represent the distribution of possible scores. A team can have a higher expected intensity while still facing a meaningful draw risk, or while being exposed defensively.
Later in the series, Technical Note V explains why goal lambdas deserve their own dedicated engine for BTTS, Over/Under and likely scores. Here, the important point is that Foresportia models both outcome probabilities and goal structure.
7. From a score grid to 1X2 probabilities
A score grid assigns probability to each scoreline:
1X2 probabilities can then be obtained by summing regions of that grid:
This gives the model a coherent probabilistic foundation. However, Foresportia does not treat this as a fixed mathematical prison: if goal markets are better calibrated with a dedicated goal engine, the model can separate outcome modeling from goal-market modeling.
8. Calibration: turning raw scores into usable probabilities
A raw model score is not automatically a usable probability. Calibration is the process that aligns predicted probabilities with observed frequencies.
The goal is simple: if the model says 60%, similar events should happen around 60% of the time. Calibration is therefore a quality constraint, not a cosmetic adjustment.
This is also why Foresportia publishes past results and evaluates its model continuously. A probability is only meaningful if it remains testable against completed matches.
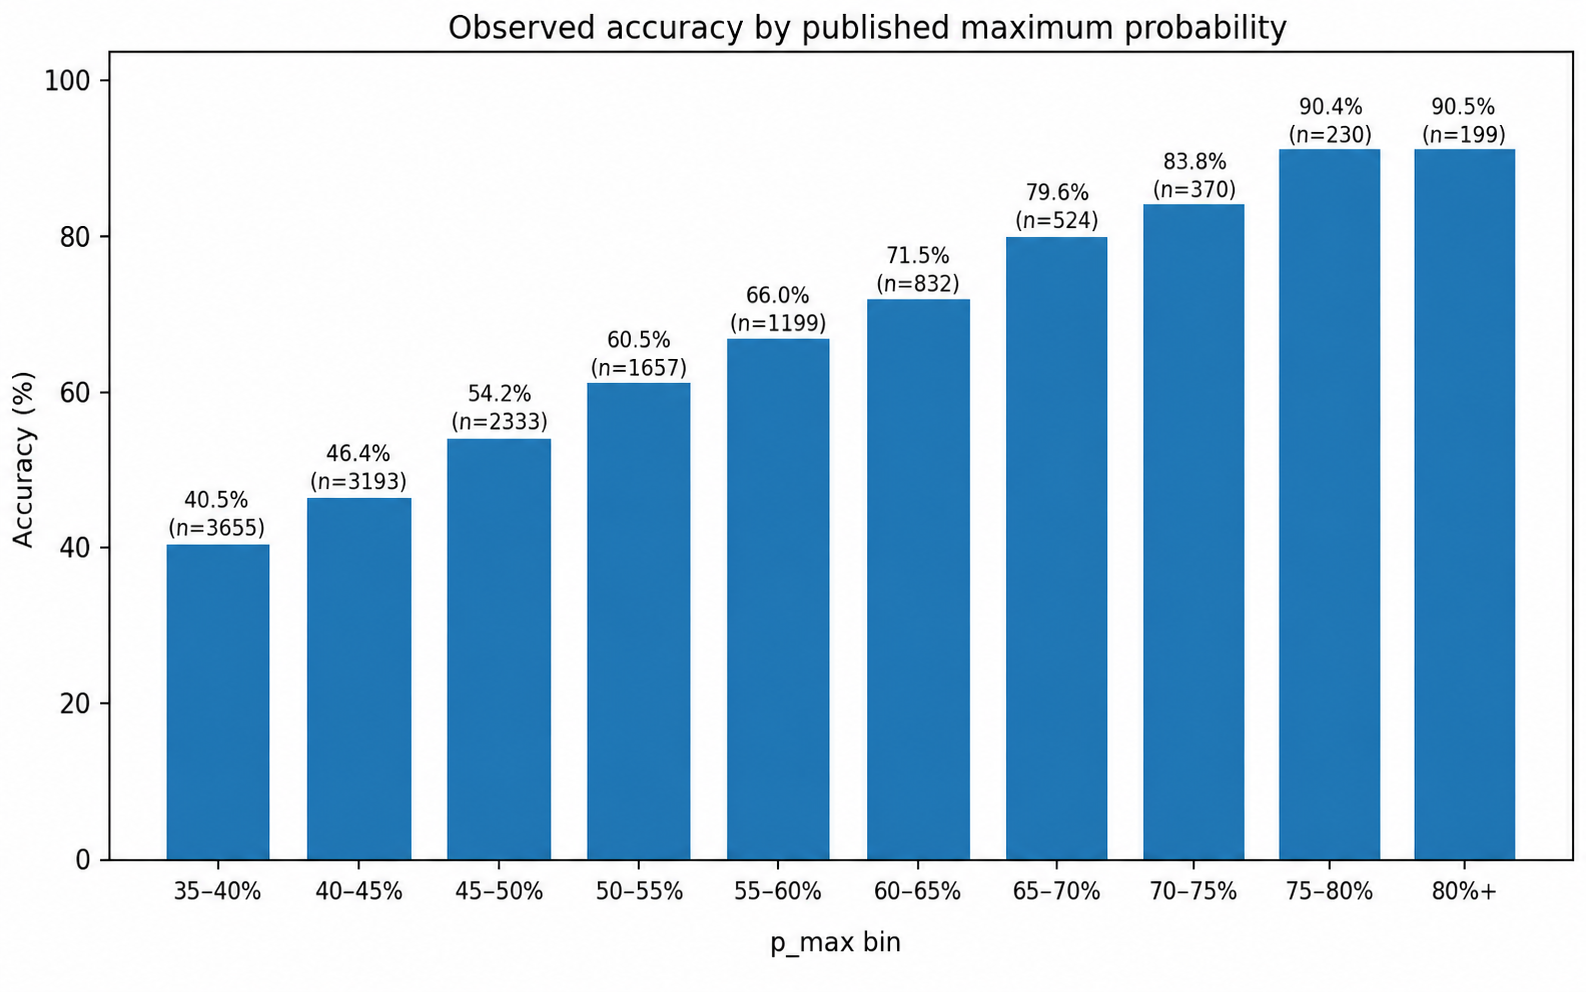
9. When maximum probability becomes informative
The maximum probability is the strongest class in the 1X2 distribution:
It is a first indicator of signal strength. However, it should not be read alone. A high p_max is more meaningful
when it comes with a clear margin over the second outcome and a lower-entropy distribution.
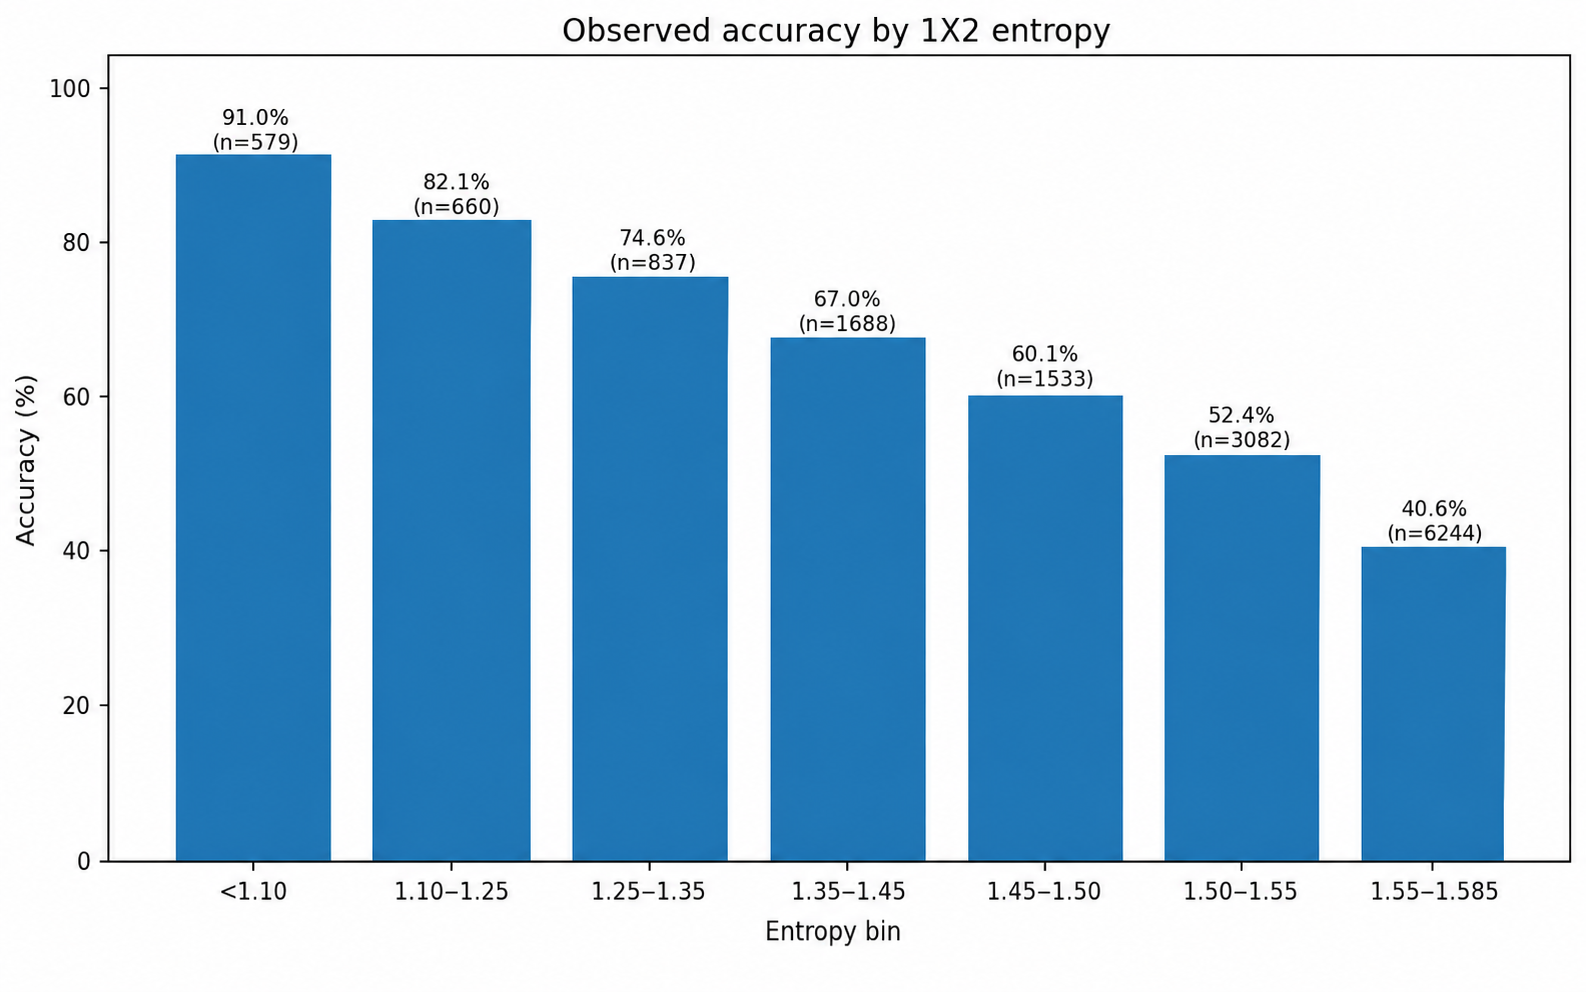
10. Entropy: measuring how readable the distribution is
Entropy measures the dispersion of the 1X2 distribution:
In a three-outcome 1X2 problem, maximum entropy is:
High entropy means the model sees a diffuse match. Low entropy means probability mass is more concentrated. Entropy therefore helps distinguish a real signal from a top pick that exists only because one class must be slightly above the others.
11. From probabilities to stability badges
Foresportia turns probability structure into a product reading: Stable, Correct or Risk. The simplified logic is:
where C combines maximum probability, margin, entropy, historical league stability and contextual signals.
The purpose is not to make every match look attractive. It is to separate matches where the signal is more stable from
matches where uncertainty remains dominant.
Across the historical sample, global 1X2 accuracy is around 54%, but the Stable + Correct segment reaches around 78.5% while covering roughly 22% of matches. This is one of the central product ideas: the model is not only evaluated globally; it is evaluated by its ability to identify where the signal is exploitable.
12. First calibration reading: predicted probability vs observed frequency
A reliability curve compares predicted confidence with observed success frequency. If the model is well calibrated, points should move close to the diagonal: 60% predicted should correspond to about 60% observed, and so on.

This curve is not meant to claim perfection. It is a diagnostic tool. It tells where the model is underconfident, overconfident, or properly aligned with empirical frequencies.
13. Not all leagues behave the same way
A global football model has to handle heterogeneous competitions. Some leagues are structurally more stable; others have more variance, less historical depth, stronger home/away asymmetries, or more unpredictable tactical patterns.
This is why Foresportia uses league-aware calibration and continues to monitor performance by competition. A model that works well on one league can become too confident on another if league-specific behavior is ignored.
14. Opening toward goal markets
Once a match is represented probabilistically, it becomes possible to derive or estimate goal markets: likely scores, BTTS, Over/Under and expected scoring intensity. However, Technical Note V shows why these markets should not always be derived naively from the same 1X2 grid.
This is an important design choice: Foresportia favors calibration quality over artificial simplicity. If a dedicated goal model produces better empirical behavior, then the architecture should reflect that.
15. Limits: what a model cannot know
No pre-match model can perfectly anticipate hidden injuries, late tactical changes, an early red card, weather surprises, refereeing decisions or random deflections. These events are part of football uncertainty.
The correct ambition is therefore not to predict every match. The correct ambition is to estimate probabilities honestly, identify stable segments, expose weak areas, and improve when enough evidence accumulates.
Conclusion: value lies in measuring the signal
This first note introduced the foundation of Foresportia: football matches are modeled as probability distributions, not deterministic predictions. The model combines statistical structure, historical data, machine learning, calibration and context-aware confidence.
Key takeaway
Foresportia’s value is not just picking the most likely outcome. Its value is measuring when the probability distribution contains a signal strong enough to be trusted more than average.
The next note focuses on the role of AI: where machine learning actually contributes, what it can improve, and what it cannot magically solve.
Quick FAQ
Does a 60% prediction mean the result is almost certain?
No. A 60% event should still fail about 40% of the time over many comparable cases.
Why does Foresportia use probabilities instead of direct predictions?
Because football is noisy. Probabilities allow uncertainty to be measured and validated against observed frequencies.
Why include machine learning if football remains uncertain?
Machine learning helps combine non-linear signals and detect useful patterns, but it does not remove randomness or guarantee outcomes.
Explore Foresportia in practice
See today’s probabilities, AI selections, historical results and the current state of the model.
View the AI program