Core idea
This article is a snapshot of the Foresportia model at a specific point in time. It does not close the scientific process: it shows how the model is measured, where it is strong, where it drifts, and how it can keep improving.
The final note: measuring instead of promising
The previous notes described the foundations of Foresportia: probabilistic modeling, the role of AI, confidence signals, contextual flags and goal markets. This final note closes the loop: how should a football prediction model be evaluated without turning it into marketing?
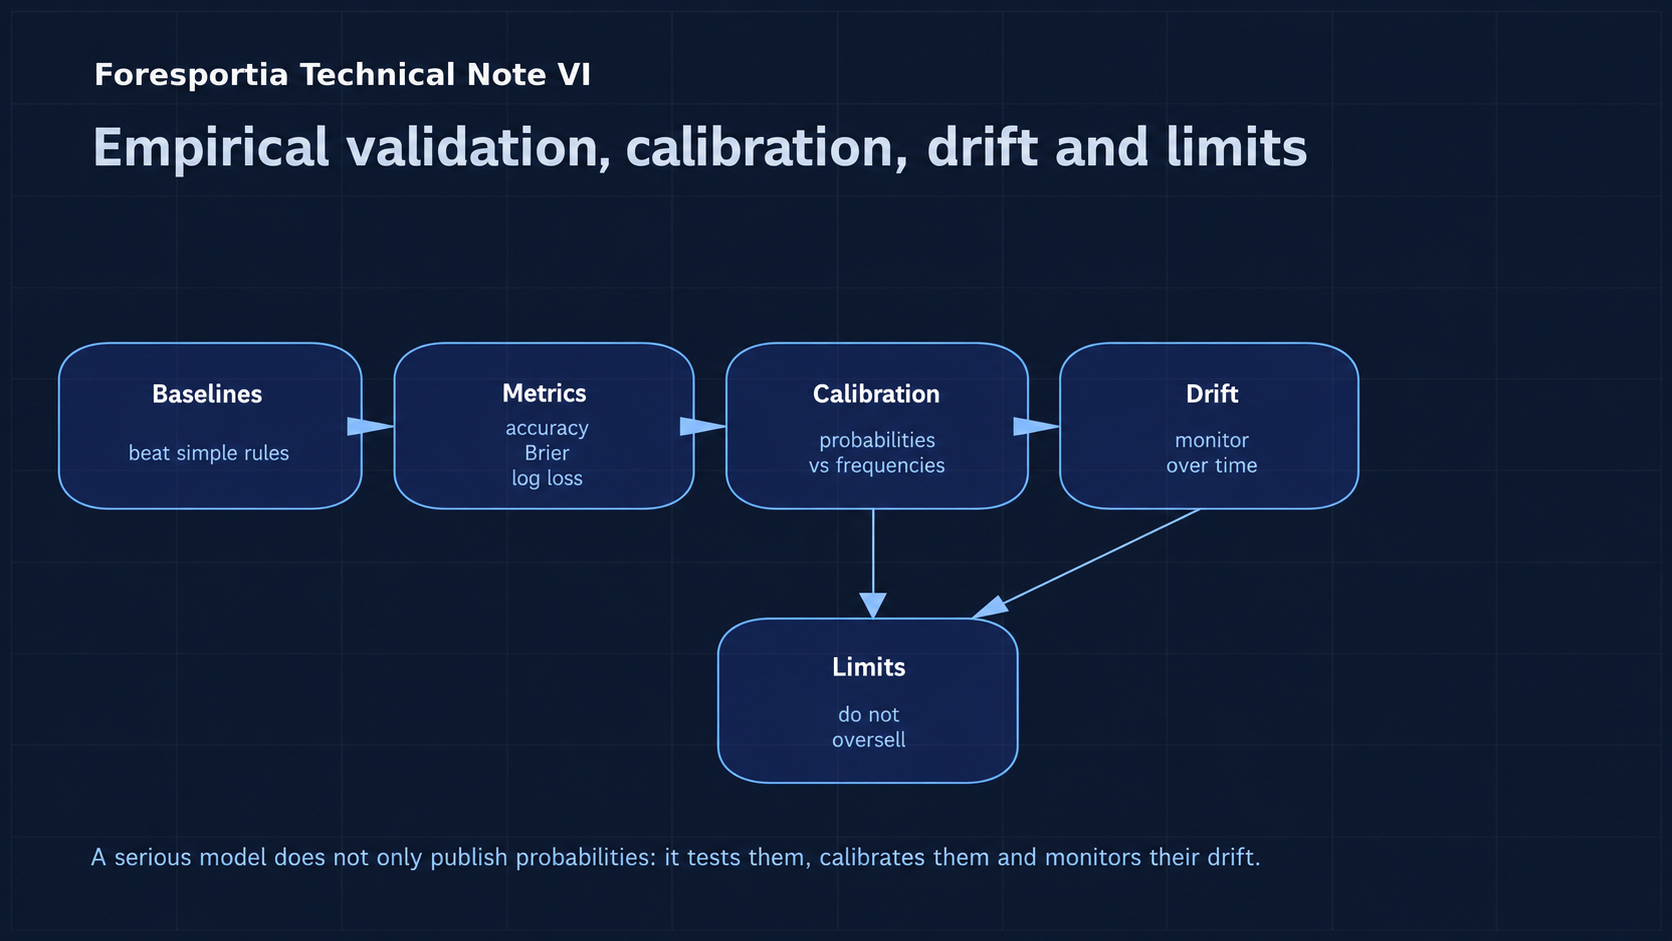
The answer is to compare it with baselines, measure probability quality, monitor drift, expose limits and improve the engine when the data provides reliable evidence. A serious model is not the one that claims certainty. It is the one that remains measurable and correctable.
The metrics below should therefore be read as the model’s state at a given time. The current Foresportia program and its improvement cycles are also tracked on the AI football prediction program page.
1. A compact formula for the full Foresportia system
The whole series can be summarized with a compact formula:
For a match M, at time t, the engine transforms multiple signal families into probabilistic outputs:
where p̂1X2 is the home/draw/away distribution, goal lambdas drive goal markets,
C is a confidence reading, and B is the product-level badge: Stable, Correct or Risk.
The t subscript is important. Foresportia is not frozen. The model changes with data coverage, leagues,
calibration, safeguards and detected drift. A public metric is a snapshot, not a permanent truth.
2. What each note contributed
3. Baselines: a model must beat simple rules
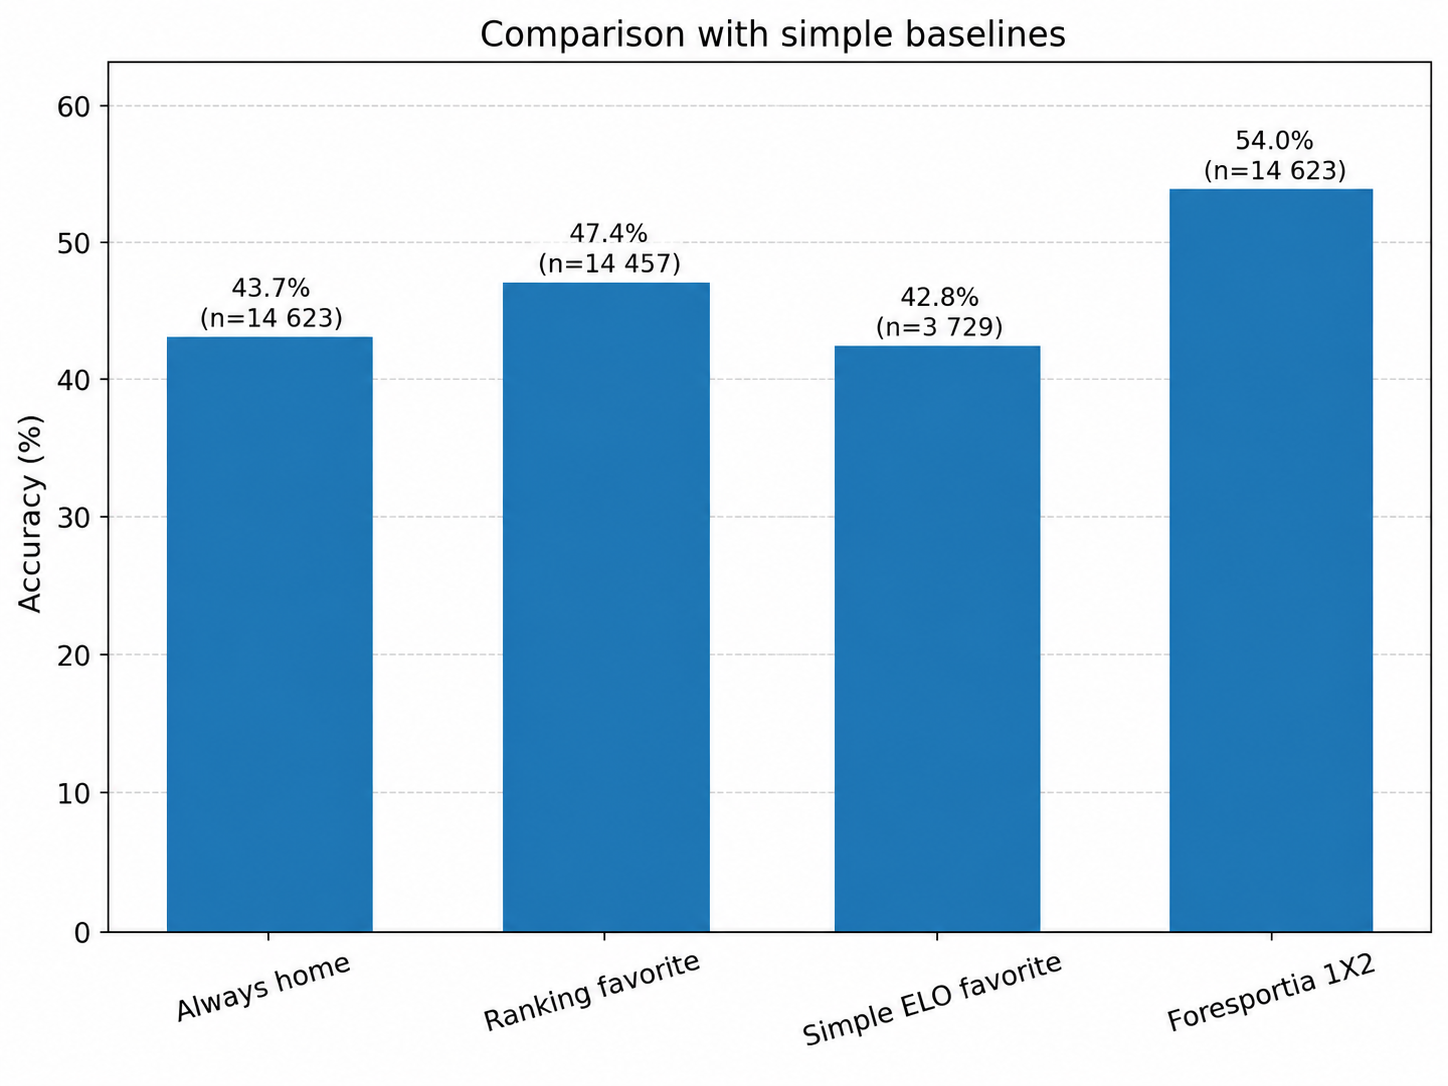
A prediction model only has value if it improves upon simple baselines. Always choosing the home team, following a ranking favorite, using a basic ELO favorite or relying on a naive prior all provide reference points.
Baselines are not there to flatter the model. They define the minimum level that a more complex architecture must exceed. If a model cannot beat simple rules, its complexity is not justified.
4. Understanding the metrics: accuracy, Brier score, log loss and ECE
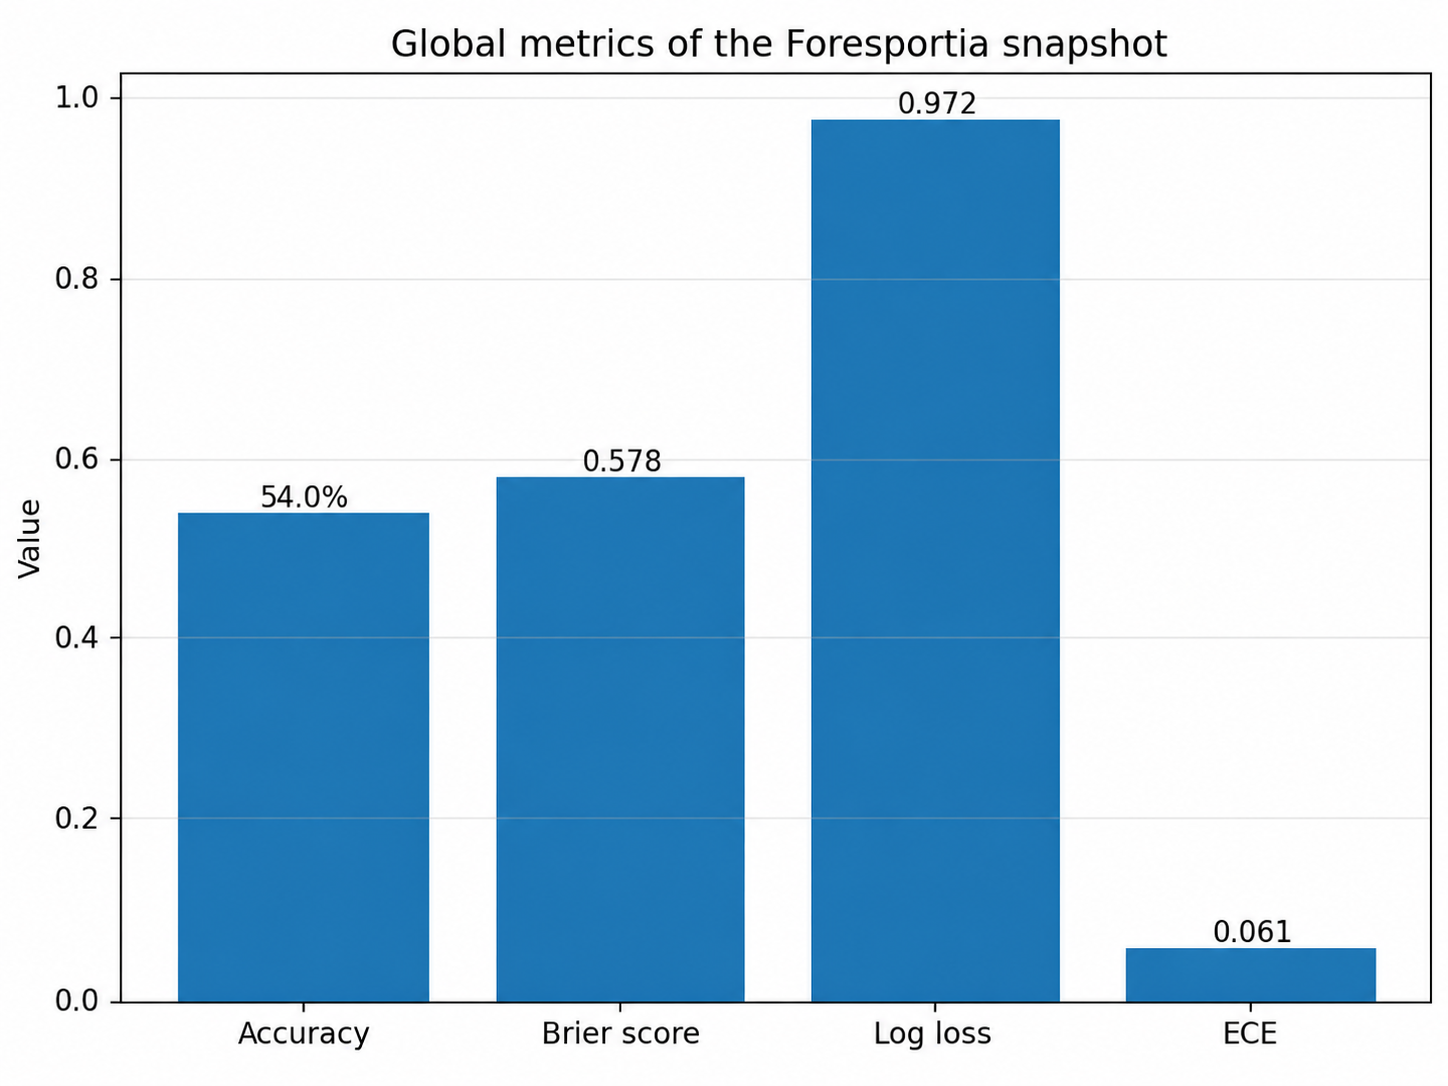
Accuracy measures whether the top predicted outcome is correct:
But a probability model needs more than accuracy. The multiclass Brier score measures the squared distance between the predicted 1X2 distribution and the observed result:
In this convention, 0 is perfect. A uniform 33/33/33 prediction over three outcomes would be around 0.667. A measured value around 0.579 is therefore better than a non-informative distribution, but not yet an extremely sharp probabilistic model.
Log loss penalizes confident mistakes very strongly:
A uniform three-class prediction gives ln(3) ≈ 1.099. A measured value around 0.972 indicates that the model carries a real signal, while still leaving room for better calibration and better draw handling.
ECE, or Expected Calibration Error, measures the average gap between predicted confidence and observed accuracy:
An ECE around 0.061 means an average calibration gap of about 6.1 percentage points across probability bins. It is not perfect; it is a useful diagnostic for the next calibration cycles.
Brier score and log loss are calculated over all completed matches. They include Risk matches, noisy leagues, low-confidence probabilities and structurally difficult situations. The product value of Foresportia comes largely from identifying the subsets where the signal is strongest, not from pretending that every match is equally predictable.
5. Calibration: probability should behave like frequency
A probability is useful only if it behaves like an observed frequency. If the model says 60%, then comparable events should occur roughly 60% of the time over a sufficient number of cases.
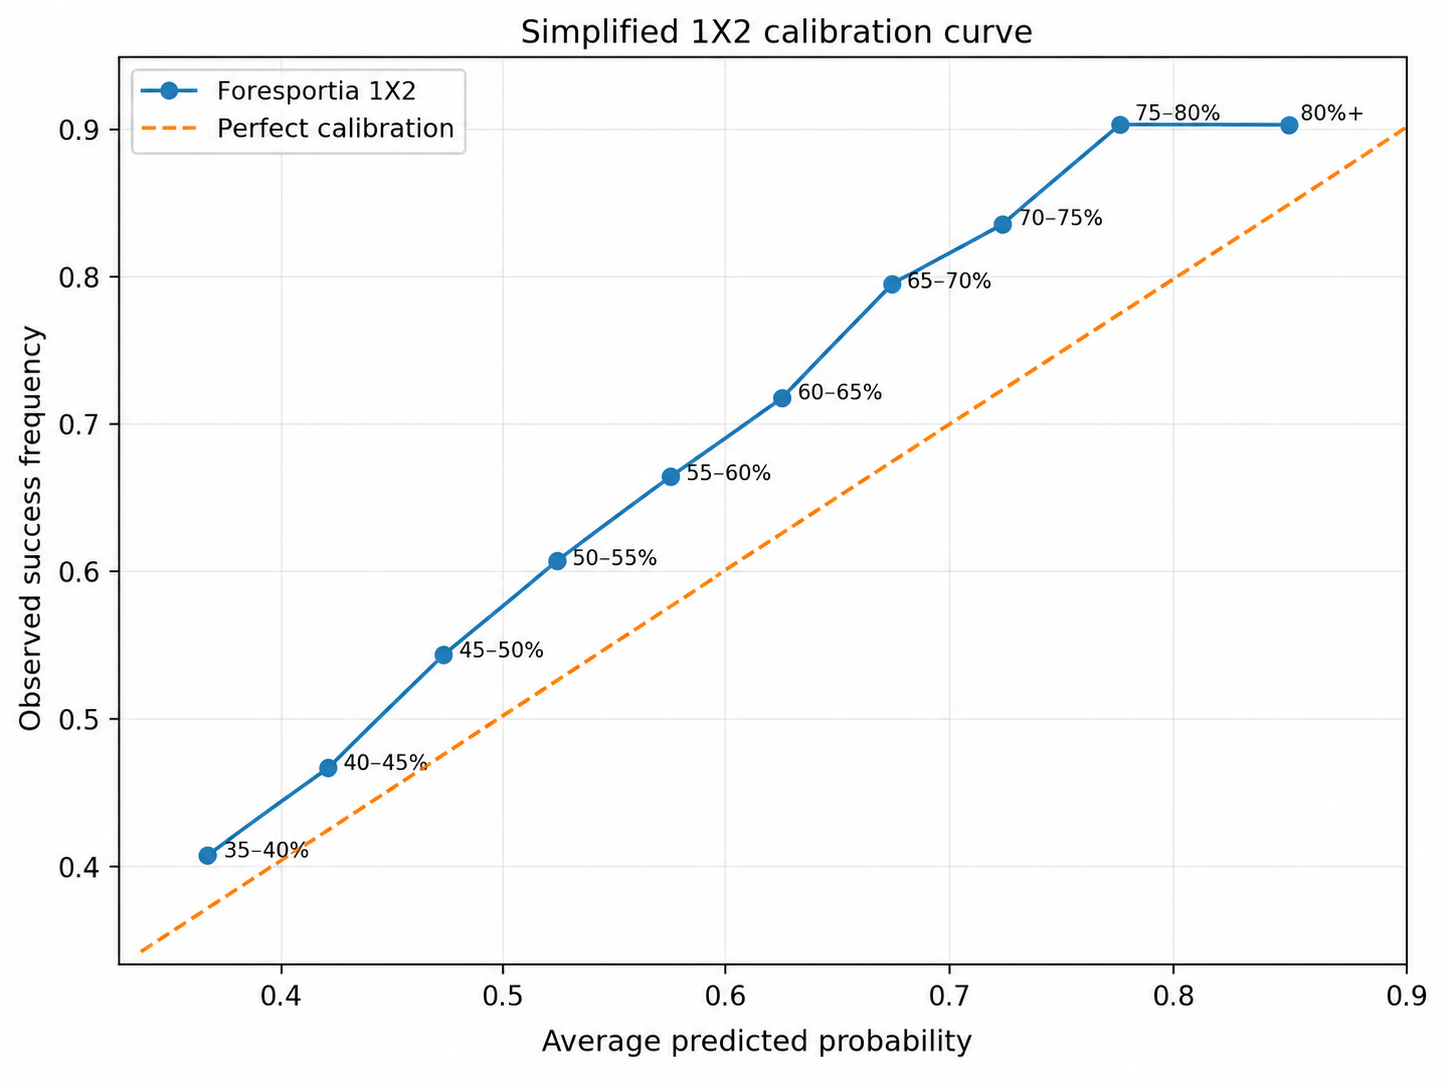
A model can have good accuracy and still be poorly calibrated. It can rank matches correctly while being too confident about favorites. This is why Foresportia separates raw probability, confidence, badges and empirical validation.
6. Segment validation: the real value of confidence badges
Stable, Correct and Risk badges only matter if they separate different empirical regimes. In the current snapshot, Stable + Correct reaches about 78.5% accuracy while covering roughly 22% of matches. Risk covers a much larger share, with much lower accuracy.
The model does not aim to make every match look playable or safe. It accepts that most matches remain uncertain, and tries to identify the areas where the signal is more stable.
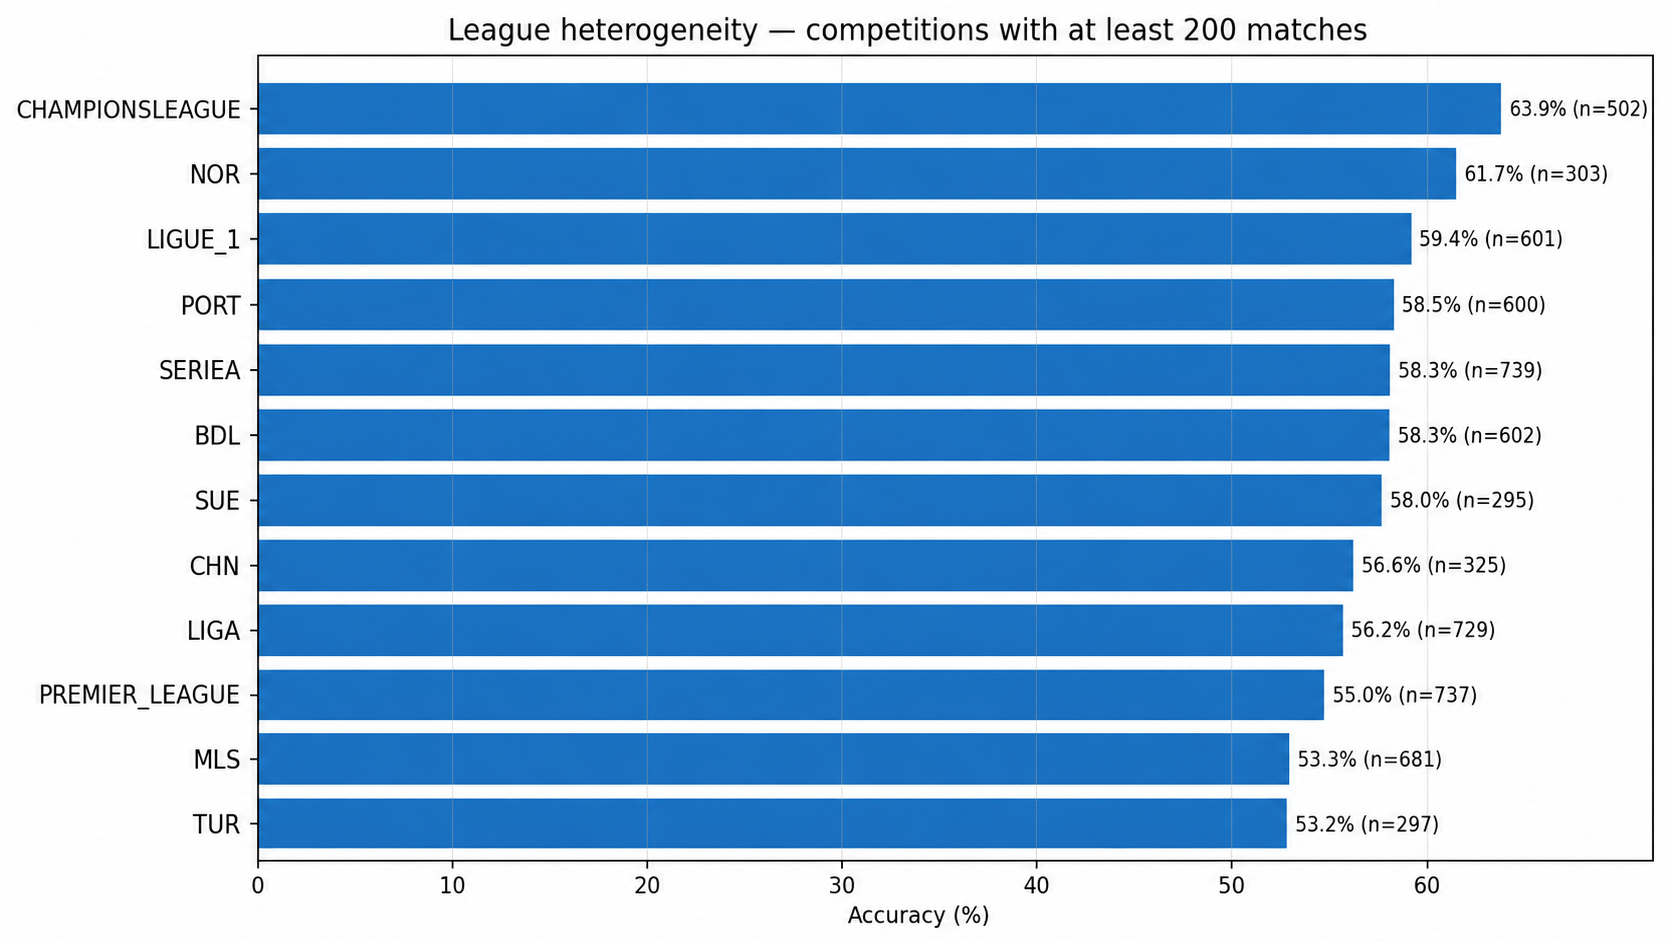
7. League heterogeneity: expanding coverage increases uncertainty
The more leagues Foresportia covers, the more distributions the model must handle: stable domestic leagues, high-variance leagues, competitions with limited historical depth, irregular schedules and teams that are less well observed.
This is valuable for the product, but it increases statistical difficulty. It also explains why calibration must be monitored by league, market and segment rather than only through one global number.
This is also why event pages such as the 2026 World Cup deserve a specific reading: a short international tournament is not statistically equivalent to a long domestic league.
8. Temporal drift: a drop is also a signal to work from
Drift is a change in performance over time. It can come from a season phase, a new model version, additional leagues, changing data coverage or a temporary imbalance in the sample.
The right question is not “is the model good or bad?”. The right question is: where does the model change behavior, and what should be corrected?
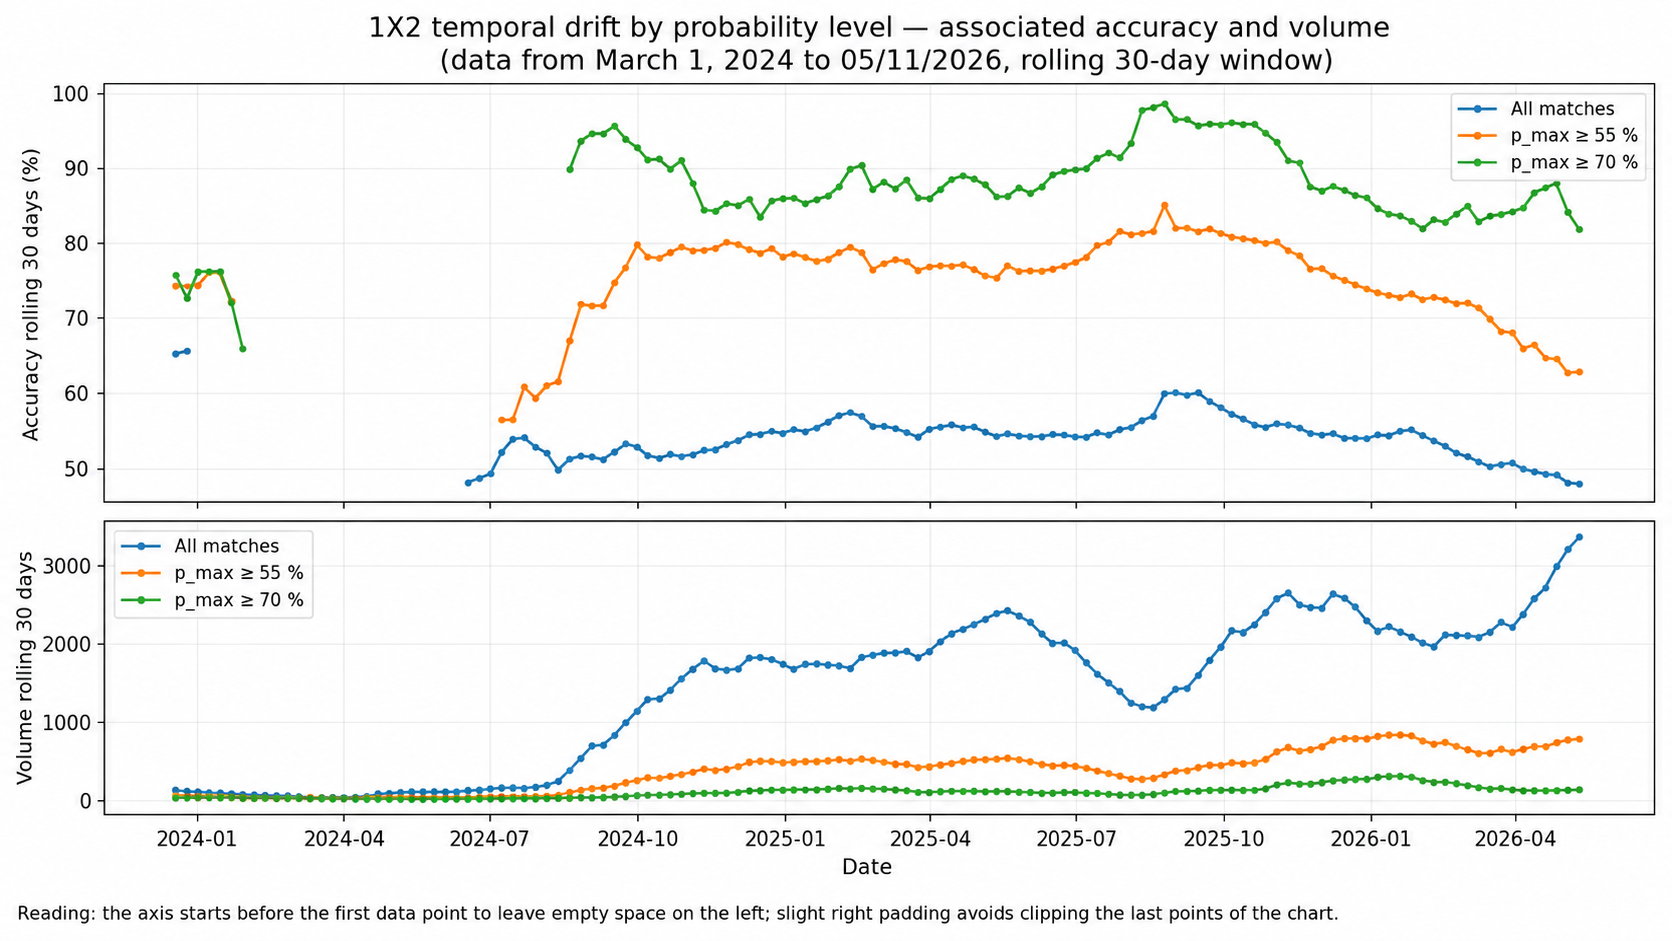
A weaker period can appear when the engine expands coverage to more leagues or competitions with higher uncertainty. This is not a reason to hide the curve. It is exactly the kind of signal that triggers continuous improvement: recalibration, safeguards, context flags and better segmentation.
9. The main strength: an improvable and partially autonomous model
Foresportia is not just a fixed set of formulas. It is designed as a loop: pre-match predictions, completed results, comparison with published probabilities, drift detection, recalibration, threshold adjustment and new engine versions.
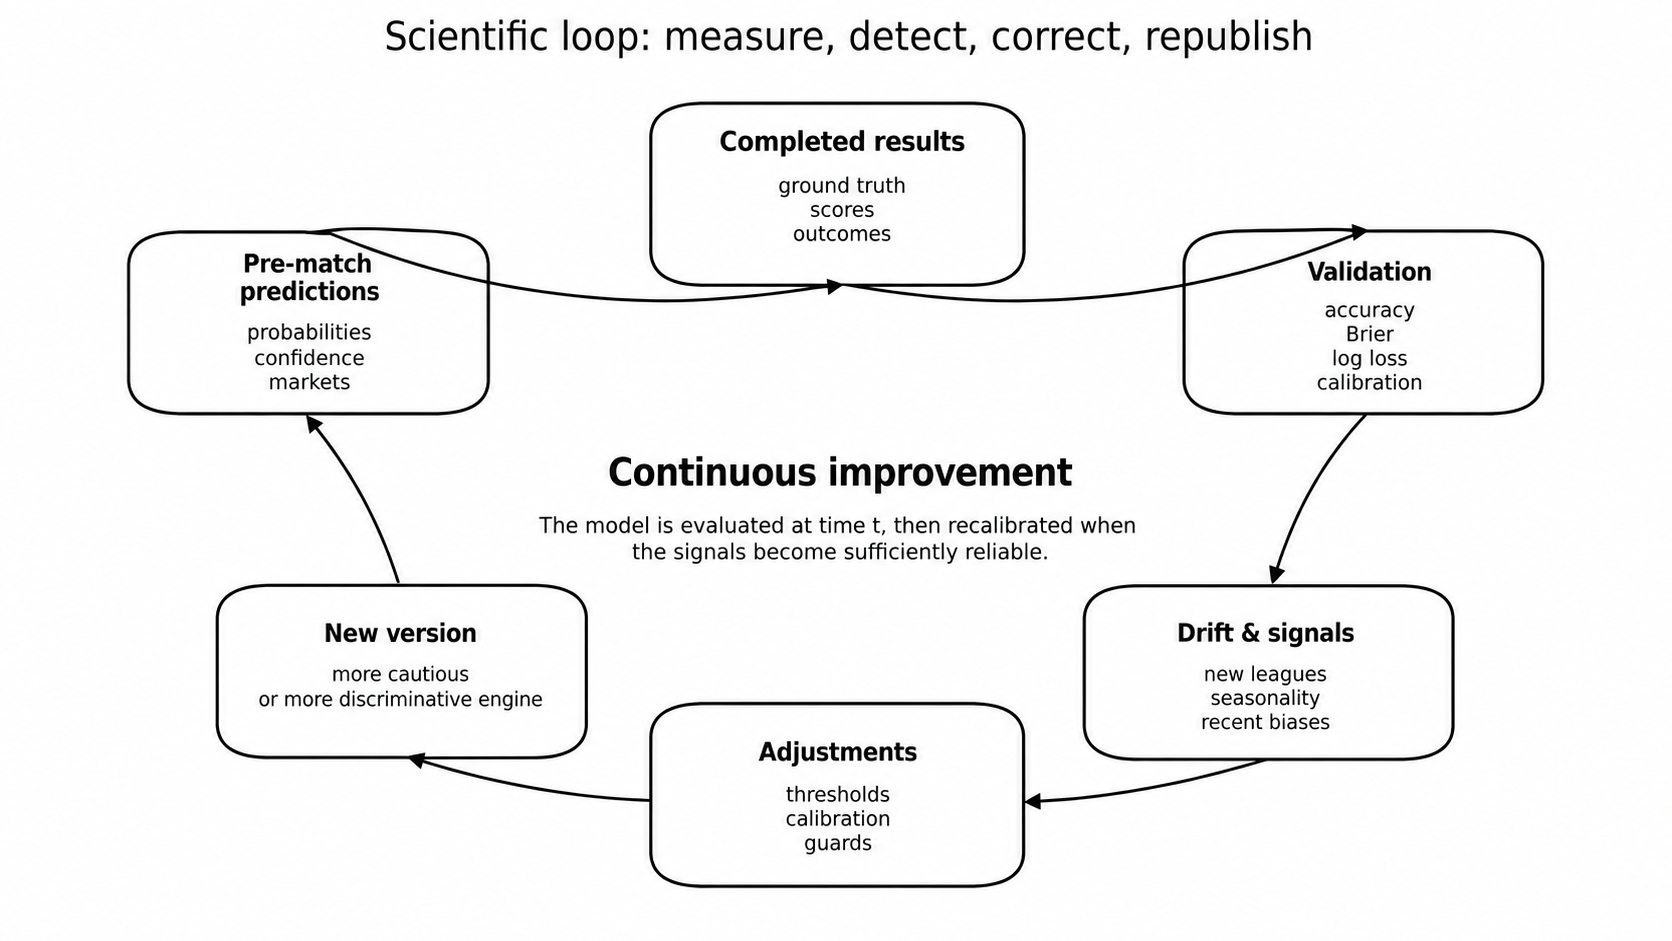
This autonomy does not mean that the model changes randomly. It means that it can react when signals become reliable enough: a drifting league, an over-permissive threshold, an aggressive goal market, or a confidence segment that becomes overestimated.
The model should learn from today’s errors, but under constraints. It should not overreact to three isolated matches; it should update when the evidence becomes robust.
10. Goal markets: a major lesson from the series
Technical Note V showed a key architectural decision: BTTS, Over/Under and likely scores should not be naively forced out of the same grid as 1X2. The 1X2 model measures the final outcome; goal markets measure match intensity.
This is a good example of the Foresportia philosophy. When a market needs a dedicated model, it is better to build one, calibrate it and validate it than preserve a misleading mathematical simplicity.
11. Why publish this level of detail?
This series was not written to sell certainty. It exists because the project is scientific at its core: model uncertainty, make assumptions visible, measure errors, expose limits and keep improving.
Foresportia does not use betting affiliate links, and that is a deliberate choice. The goal is not to push users toward a bookmaker. The goal is to provide a more rigorous data-driven reading of football. The About page explains this approach in more detail.
For advanced users, the Foresportia API is available. For upcoming major events, such as the 2026 World Cup, the objective will be to adapt this probabilistic framework to a short, rare and highly specific tournament context.
12. Final limits
A probability is not a certainty. A Stable badge can fail. A favorite can lose. A match can turn on a red card, a penalty, an injury, a tactical surprise or a low-probability finishing event.
The right goal is not to be correct on every match. The right goal is to remain better calibrated, more honest about risk, able to detect drift and transparent enough for users to understand what they are reading.
Conclusion: a scientific snapshot, not a final endpoint
This series represents a snapshot of the Foresportia engine at a given time. It shows a useful system with encouraging results, visible limitations and concrete improvement paths.
Series takeaway
Foresportia is not designed as a promise of certainty. It is a probabilistic modeling system built around signal measurement, empirical validation and continuous improvement.
If this series leaves one idea, it is this: the value of a sports prediction AI is not its confidence. It is its ability to measure uncertainty and improve honestly when results arrive.
Quick FAQ
Are the metrics final?
No. They represent the model at a point in time. The engine evolves with data, leagues, calibration and improvement cycles.
Does drift mean the model is bad?
No. Drift means performance is changing. It can come from new leagues, seasonal effects or a calibration issue that should be corrected.
Why publish model limits?
Because a serious probability model should be testable and falsifiable. Hiding limits would make it less credible, not stronger.
Explore Foresportia after the series
See the current AI program, today’s matches, past results, API access and major-event pages.
- Foresportia AI football prediction program
- Today’s matches
- Past results
- Foresportia API
- 2026 World Cup