Core idea
The 1X2 model answers one question: who is most likely to win? Goal markets answer a different question: how is the match expected to unfold in terms of scoring volume and score structure? These questions are related, but they should not be calibrated with exactly the same engine.
Why this article matters
A natural approach is to derive every football market from a single score grid: build a matrix coherent with the 1X2 distribution, then sum areas of the matrix to obtain BTTS, Over 2.5, Under 2.5 or likely scores. This is elegant, but it has a major limitation: a grid optimized for the final outcome is not necessarily optimal for goal volume.
Foresportia therefore separates two readings. The 1X2 model is calibrated to distribute probability across home win, draw and away win. Goal markets use a dedicated engine, with lambdas designed for attacking intensity, then a calibration and lightweight AI layer to correct observed biases.
Saying that goal lambdas differ from 1X2 lambdas does not mean that the 1X2 model is poorly calibrated. It means that we do not force one mathematical object to answer two different questions. The 1X2 model must be good at outcomes; the goal model must be good at intensity and score structure.
1. Why not derive everything directly from 1X2?
Two matches can have similar 1X2 probabilities while having very different goal profiles. A favorite can win often in
low-scoring matches, or win often in open matches. The same P(H) can therefore correspond to very different
score matrices.
This formula shows that a 1X2 probability is a sum over many score cells. But the reverse problem is not unique:
knowing P(H), P(D) and P(A) is not enough to reconstruct a reliable goal distribution.
The same 1X2 profile can hide more 1-0 / 1-1 scenarios, or more 3-1 / 2-2 scenarios.
If goal markets are forced to follow a score grid reweighted for 1X2, one may preserve apparent mathematical consistency while degrading BTTS and Over/Under. The dedicated goal engine exists precisely to avoid that trade-off.
2. Goal lambdas: measuring intensity, not only the winner
The goal engine starts by estimating two scoring intensities:
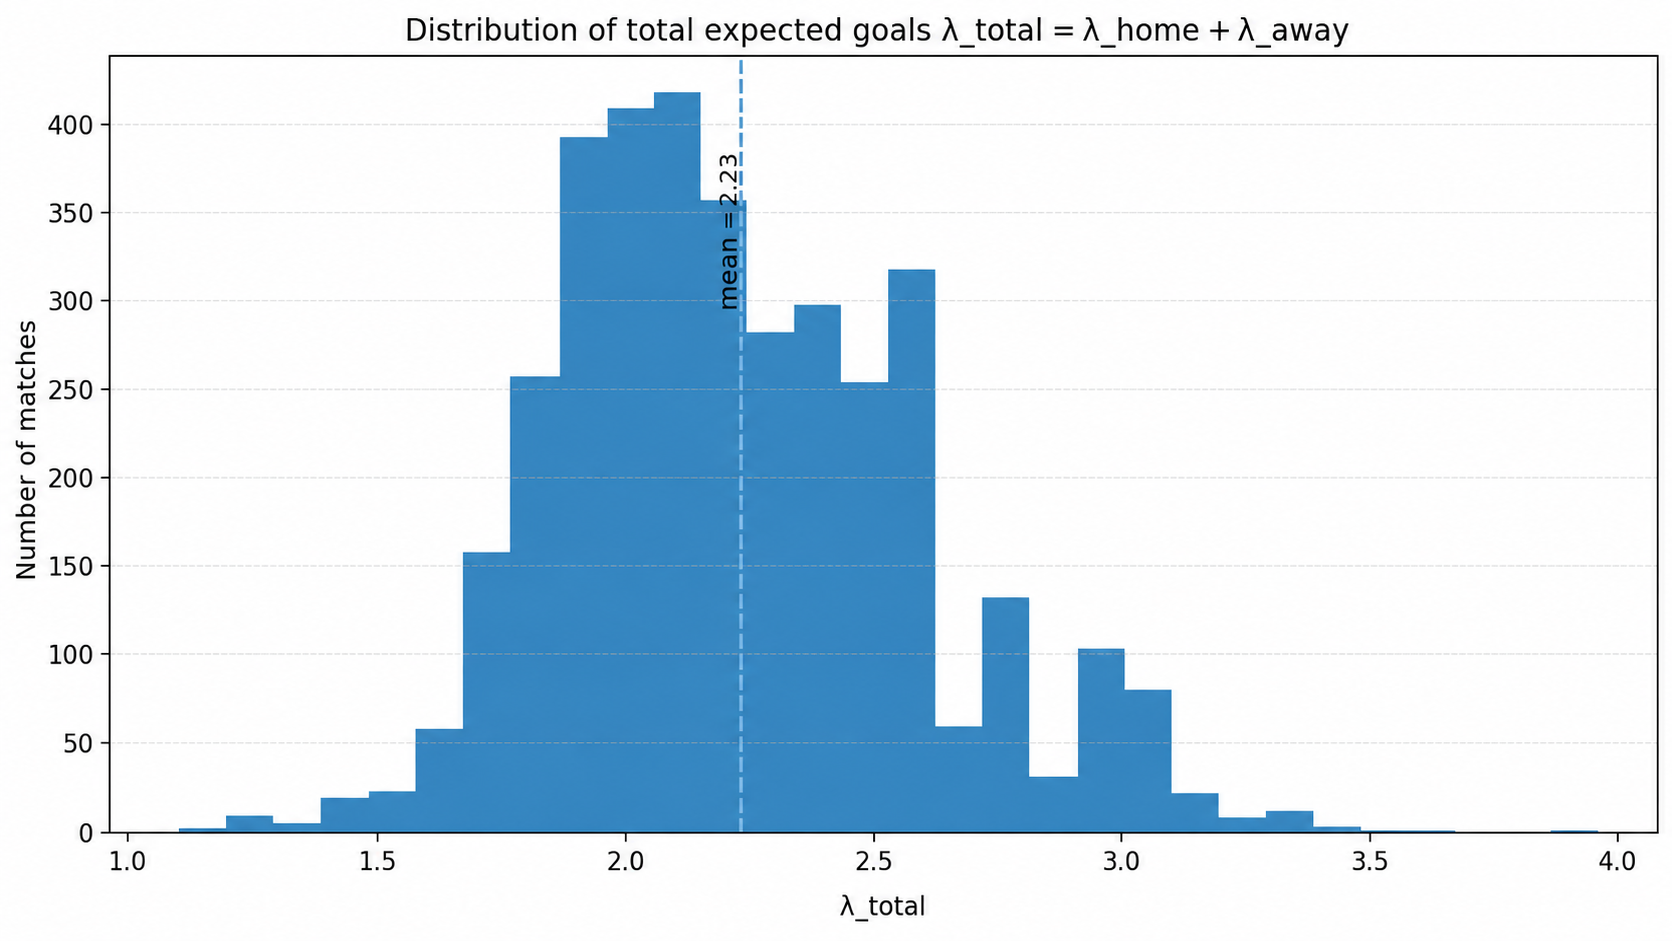
These lambdas are not exact score predictions. A λH of 1.70 does not mean the team will score
1.70 goals. It means that the distribution of its goals is centered around a certain attacking intensity.
The important point is that these lambdas are goal-market oriented. They can use attacking and defensive signals, league pace, recent form and safeguards for weak data, without being forced to match every transformation required by the 1X2 engine.
3. Why a pure Poisson model is useful, but not enough
The classic starting point is to model goals with a Poisson distribution:
This is useful because football is a low-count sport. But it imposes strong assumptions: variance tied to the mean, simplified independence between team goals, and difficulty representing certain low-score or very open matches.
In practice, a goal model must handle overdispersion, league effects, balanced or unbalanced lambdas, and the fact that BTTS or Over 2.5 do not respond to exactly the same signals as 1X2.
This simplified expression illustrates the role of a dispersion parameter: the engine does not rely only on two goal means. It also adjusts the shape of the distribution according to expected openness, balance between teams, 1X2 entropy, strength signals and league priors.
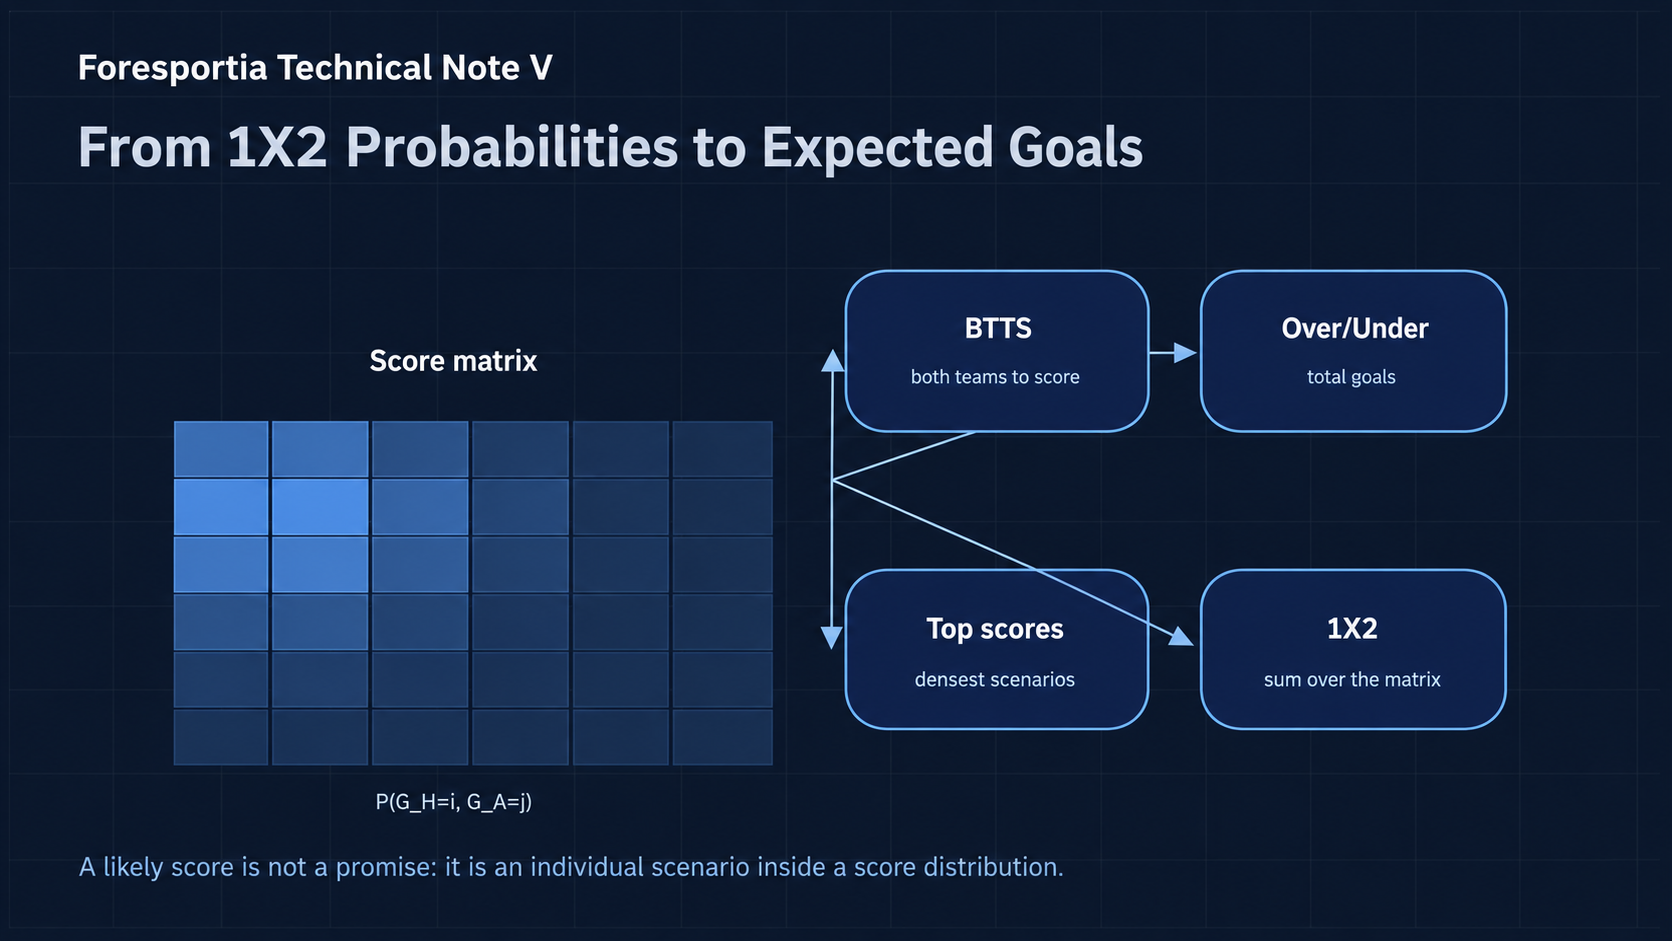
4. From lambdas to a score distribution
Once lambdas are estimated, the model builds a matrix:
Each cell represents a possible score. The matrix can then be used to compute several markets by summing regions. This gives the approach its internal coherence: BTTS, Over/Under and likely scores come from the same goal distribution.
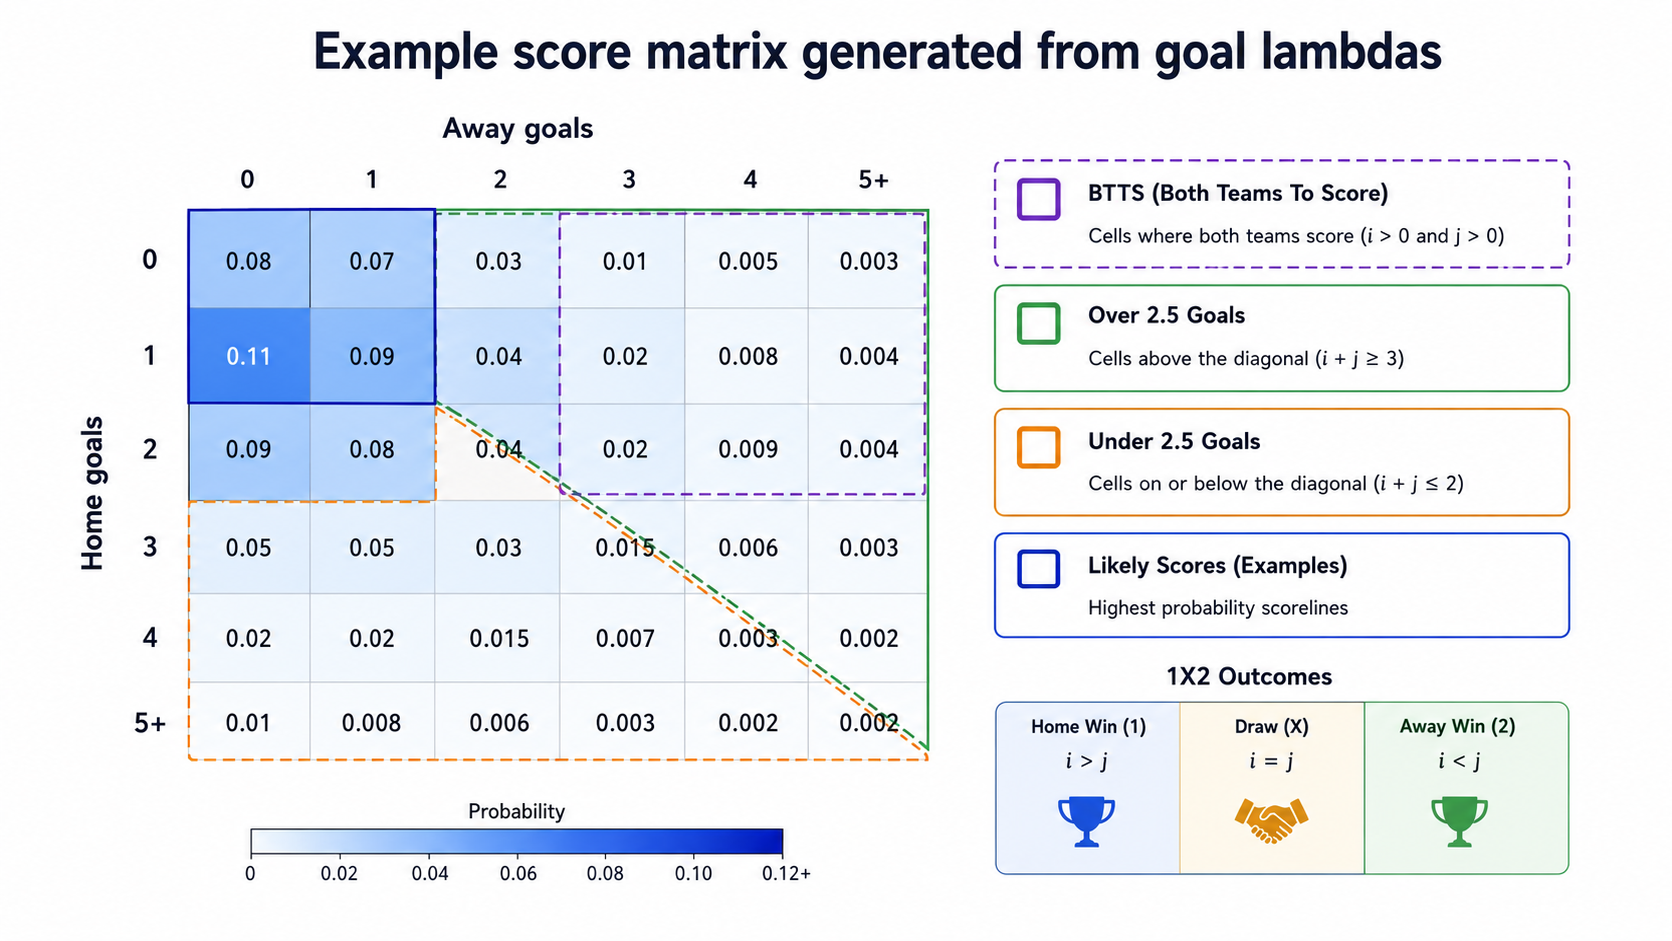
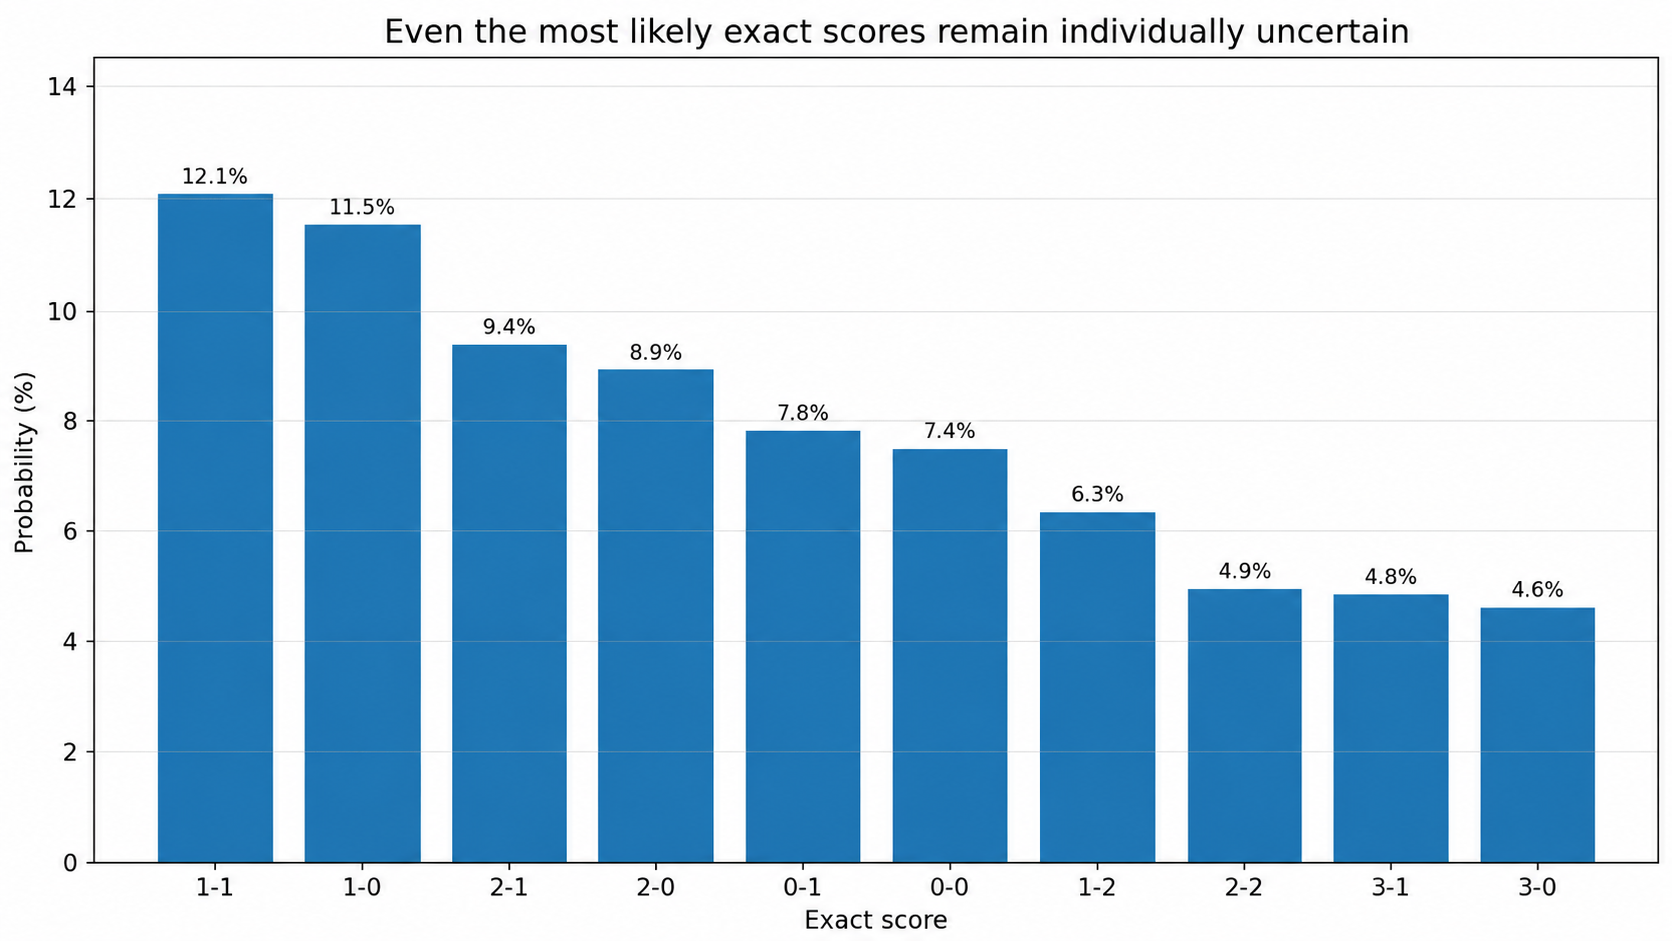
The most likely exact score can still be individually unlikely. Even a leading 1-1 or 2-1 scenario may only carry a few percent of probability. The matrix should therefore be read as a structure of scenarios, not as a promise of an exact score.
5. Likely scores: scenarios, not promises
Likely scores are the highest-probability cells in the matrix. They offer a qualitative reading of the match: closed game, open game, strong favorite, balanced matchup, draw risk, or probability that both teams score.
This is a structural limitation of football. Exact score is a very granular event, and therefore extremely hard to predict. Foresportia uses likely scores as a match-reading tool, not as a claim of exact precision.
6. BTTS and Over/Under: summing the right areas of the matrix
Once the matrix is built, goal markets become sums of score cells.
These markets are more aggregated than an exact score, so they are naturally more stable. But they are still sensitive to lambda quality, dispersion, league profile and calibration. A score grid that is coherent with 1X2 can still underestimate or overestimate how open the match really is.
7. Why neither pure Poisson nor pure AI is enough
A purely statistical model provides a solid structure: lambdas, score matrix, market sums and interpretable calibration. But if it remains too rigid, it may miss league effects, very open match profiles, contexts where goals are underestimated, or cases where weak data artificially inflates expected intensity.
Conversely, a pure machine learning model can detect interactions, but goal events are noisy: a penalty, a red card, an individual mistake or a goalkeeper performance can completely change BTTS or Over/Under outcomes. Even with a large historical sample, weak signals remain numerous and overconfidence is a real risk.
The most robust goal engine is hybrid: a statistical structure to build the goal distribution, empirical calibration to correct biases, and an AI layer to adjust parameters when historical signals indicate that a market is too conservative or too aggressive.
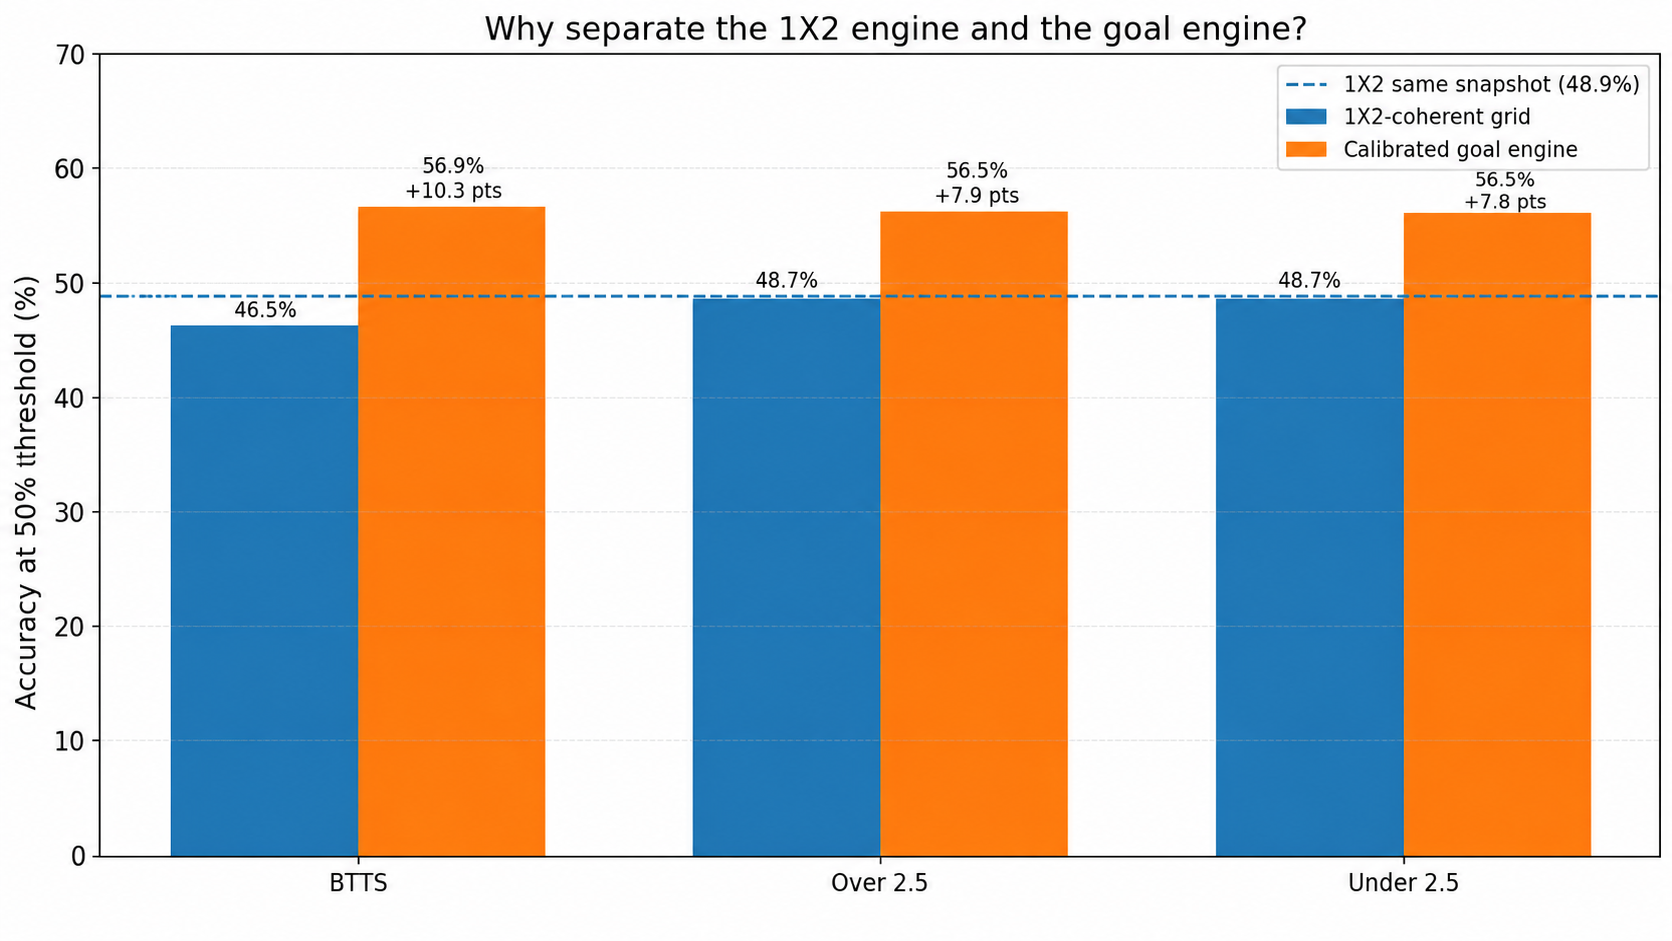
8. Key result: the dedicated goal engine beats the 1X2-derived grid on goal markets
The clearest test is to compare two approaches:
- 1X2-coherent grid: it respects the published home/draw/away distribution.
- Calibrated goal engine: it uses lambdas and calibration designed specifically for BTTS and Over/Under.
| Market | 1X2 grid matches | 1X2 grid accuracy | Goal engine matches | Goal engine accuracy | Gain |
|---|---|---|---|---|---|
| BTTS | 2,210 | 46.5 % | 2,210 | 56.9 % | +10.3 pts |
| Over 2.5 | 2,210 | 48.7 % | 2,210 | 56.5 % | +7.9 pts |
| Under 2.5 | 2,210 | 48.7 % | 2,210 | 56.5 % | +7.8 pts |
This comparison does not mean that the 1X2 model is badly calibrated. It means that 1X2 and goal markets are different prediction problems. On the same snapshot, the 1X2 task is a three-class problem, while BTTS and Over/Under are binary markets. They should be evaluated with their own lambdas, biases and calibration objectives.
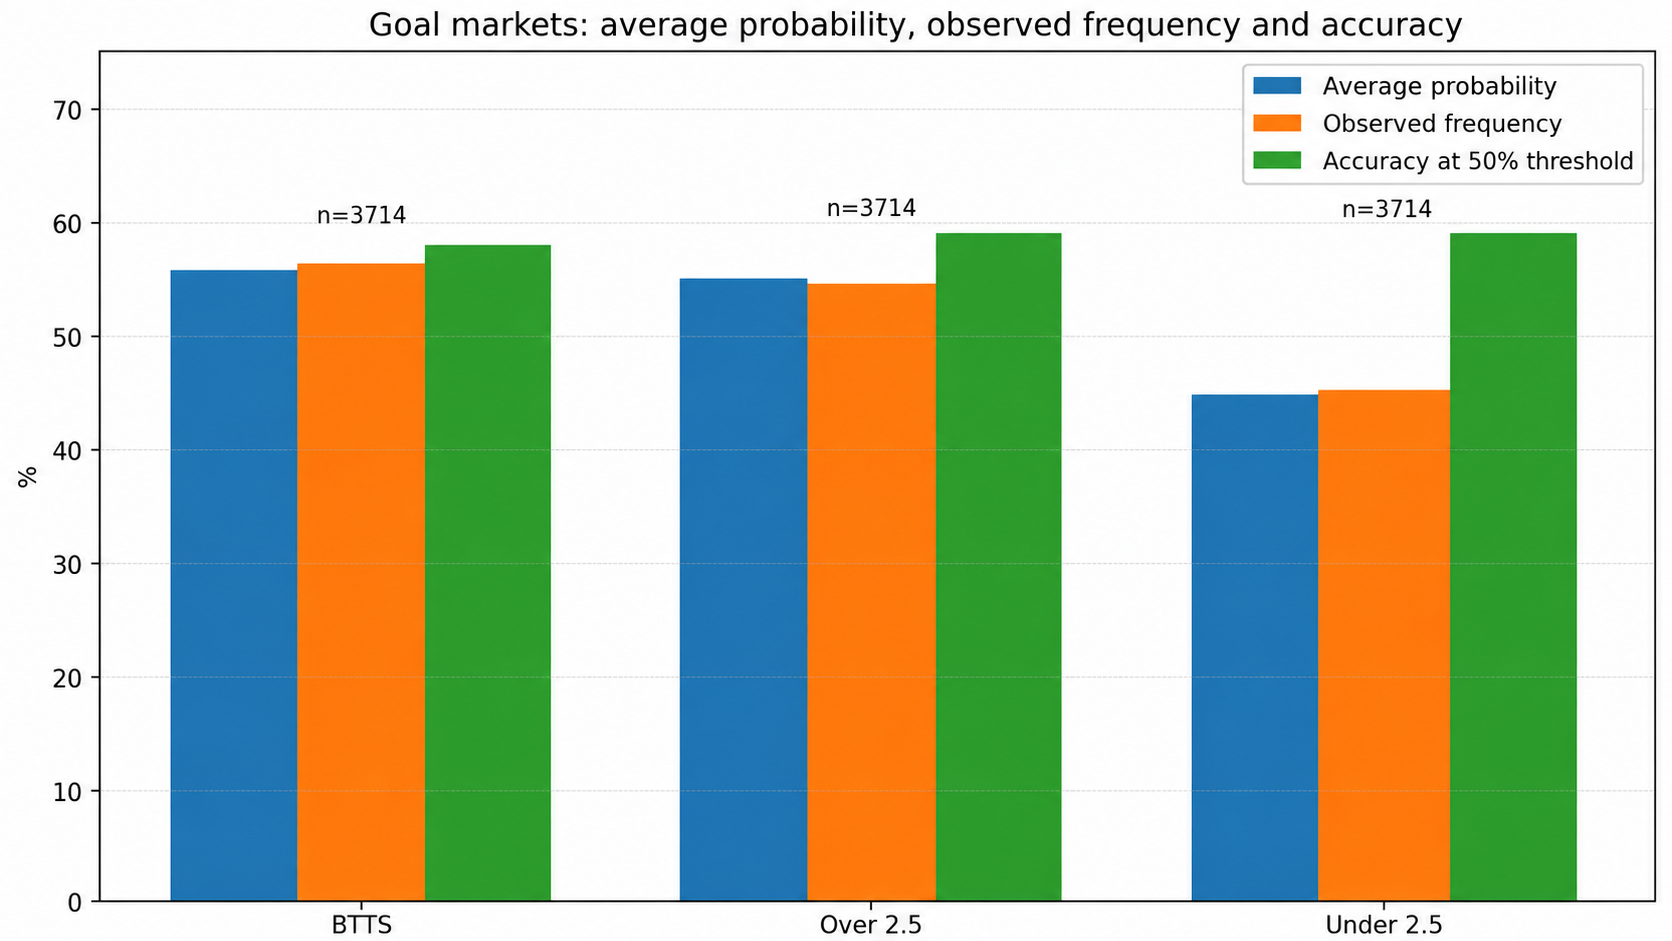
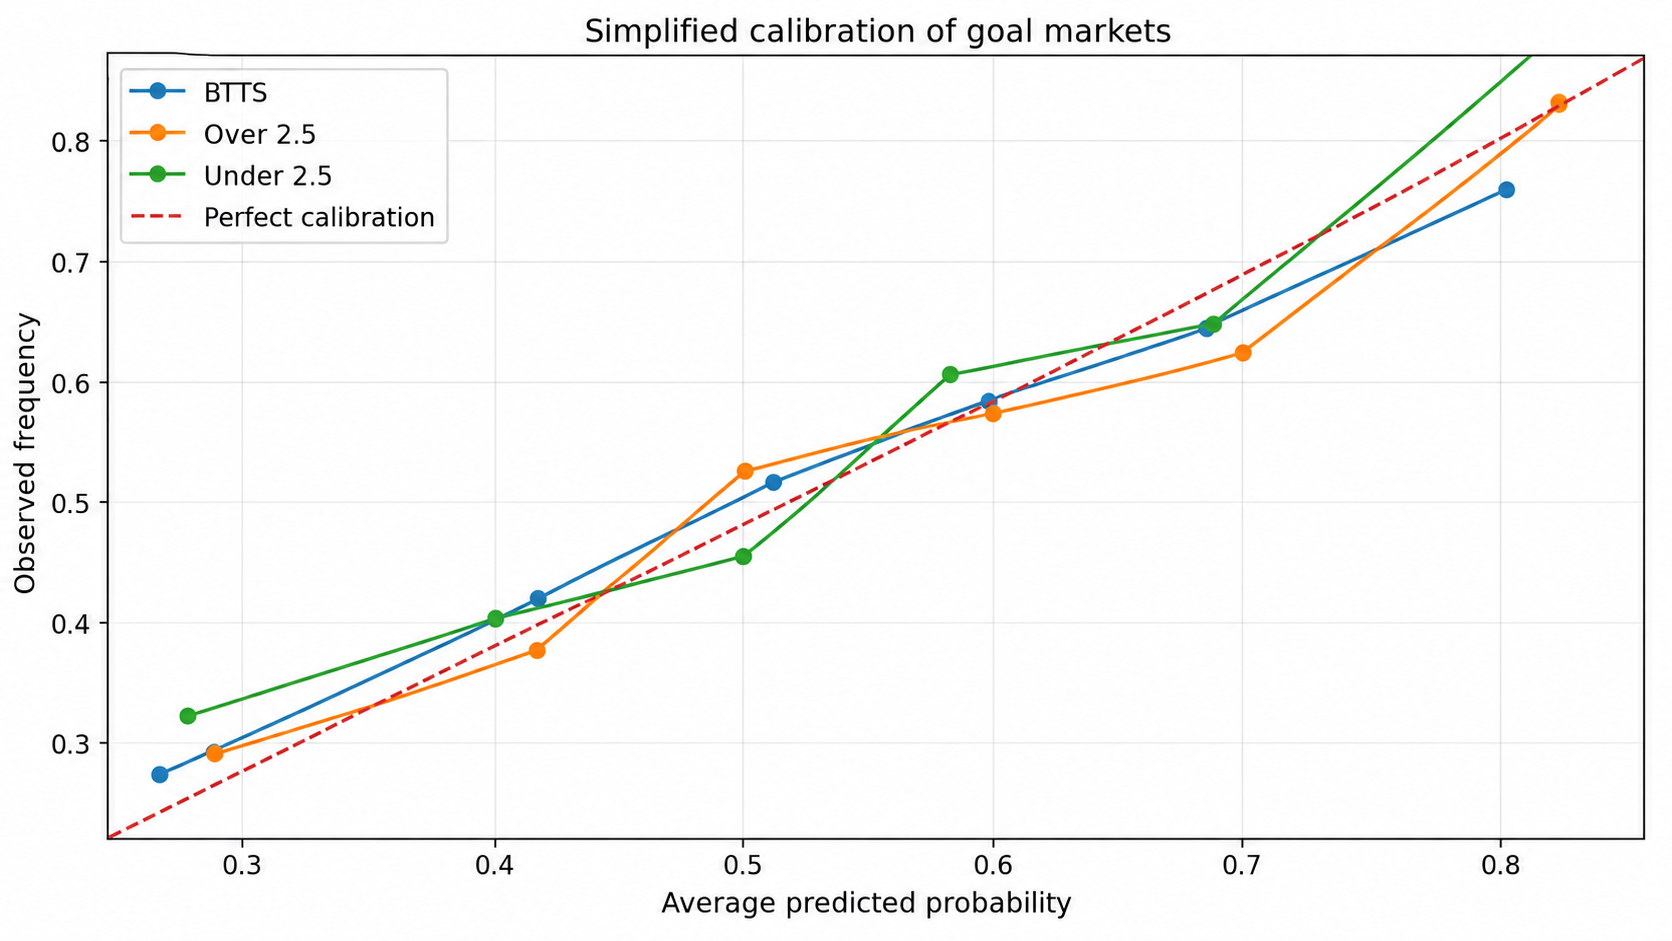
9. Empirical results and goal-market calibration
The dedicated engine is not evaluated only by accuracy. A useful probability must also be close to the observed frequency. If a market is announced around 55%, it should occur around 55% of the time over a sufficient number of comparable matches.
| Market | Accuracy at 50% | Average probability | Observed frequency | Brier | Log loss |
|---|---|---|---|---|---|
| BTTS | 56.9 % | 50.5 % | 50.7 % | 0.247 | 0.687 |
| Over 2.5 | 56.5 % | 50.3 % | 50.4 % | 0.248 | 0.689 |
| Under 2.5 | 56.5 % | 49.7 % | 49.6 % | 0.248 | 0.689 |
The signal is not spectacular in the way a cherry-picked prediction could be. But it is useful: goal markets become much cleaner when they use their own engine. The goal is not to sell certain scores, but to produce more coherent, cautious and testable goal probabilities.
10. Calibration: aligning probabilities with observed frequencies
Calibration is the layer that turns a raw model output into a usable probability. Without calibration, a model can rank matches well while being too confident or too cautious.
This expression illustrates logistic calibration: the underlying model is not discarded, but its slope and level are corrected to better align probabilities with observed outcomes.
1X2 calibration distributes probability across home win, draw and away win. Goal calibration aligns match intensity with binary events such as BTTS or Over 2.5. These objectives are related, but not identical. Calibrating them separately avoids correcting one market at the expense of another.
11. Safeguards: weak data, rare leagues and overconfidence
Goal markets are highly sensitive to small samples. A team may have played few comparable matches, a league can change pace, or a few high-scoring results can artificially inflate an average.
Foresportia therefore uses safeguards: league priors, shrinkage toward more stable references when the sample is fragile, caps on extreme lambdas, and corrections when the combination of signals looks too aggressive on BTTS or Over 2.5.
This expression illustrates a conservative mechanism: when data is fragile, the model should not artificially increase expected goal pressure. It should move back toward a more stable region.
12. Limits: what the goal model cannot promise
Even with a dedicated engine, goals remain difficult. A penalty, a red card, an injury, an exceptional goalkeeper performance, heavy rain or a very defensive tactical plan can break the expected distribution.
Exact score remains the most uncertain market. BTTS and Over/Under are more stable because they aggregate multiple scores, but they never become deterministic. The model’s role is not to promise a goal total; it is to produce a probability better aligned with observed frequencies.
Conclusion: goals deserve their own model
This note explains why Foresportia separates the 1X2 engine from the goal engine. 1X2 answers the final-outcome question. BTTS, Over/Under and likely scores answer a question of scoring intensity and match structure.
Key takeaway
A robust goal model is neither raw Poisson nor raw AI. It is a hybrid architecture: dedicated lambdas, score distribution, calibration, league priors, safeguards and learning from historical evidence.
The final note in the series explains how the whole system is evaluated: baselines, calibration, Brier score, log loss, temporal drift and scientific limits.
Quick FAQ
Why can goal lambdas differ from 1X2 lambdas?
Because they serve different objectives. 1X2 lambdas support final-outcome coherence; goal lambdas model score intensity.
Is a well-calibrated Poisson model enough?
It is a useful base, but too rigid on its own. League effects, overdispersion, very open or closed matches and empirical calibration require additional layers.
Why not use machine learning only?
Because goals are rare and noisy. Pure AI can detect weak signals, but it can also overfit. Foresportia therefore keeps an interpretable statistical structure.
See goal markets in practice
BTTS, Over/Under and likely-score probabilities are available in Foresportia’s match pages and AI selections.
View today’s matches