In short
Main message. This article is not trying to prove that Foresportia “becomes good” by looking at bookmakers. The model already has a strong signal, and its calibration shows it clearly. The real question is tougher: does that signal still add something against pre-match odds, meaning against a market that is already highly optimized?
The answer is nuanced, but very interesting: Foresportia is not designed to turn every match into a bet. It becomes useful when it filters, especially on BTTS Yes, on highly filtered Double Chance and on 1X2 Correct / Stable / Ultra stable picks. The objective is to detect value, not to convert every prediction into an automatic play.
1. First, what exactly is value?
In this article, value means a favourable gap between the probability estimated by Foresportia and the implied probability embedded in bookmaker odds. Odds are not just a price: they also define the minimum hit rate needed to break even over the long run.
Simple formula.
Value ≈ Foresportia probability × bookmaker odds − 1
Value is positive when this number is above zero. In plain terms: if Foresportia estimates that an event is more likely than the odds imply, then the pick may become interesting.
Example: odds of 2.10 require roughly 47.6% hit rate to break even. If the model estimates the event at 55%, it is not merely saying “this outcome is likely”: it is saying that the offered price may be too high relative to the underlying probability. This is exactly what Premium Odds Insights is designed to make readable.
Premium Odds Insights compares Foresportia probabilities with pre-match odds, highlights value gaps and helps separate actionable signals from simple predictions.
2. Before comparing with bookmakers: is the model well calibrated?
Before talking about ROI or value, one more fundamental point has to be checked: do Foresportia probabilities actually carry information? If a model says 70% instead of 55%, it should be right more often. Otherwise, odds comparison and value detection become statistical illusions.
This check extends our analysis of 12,000 matches on model accuracy.
That is why this curve is deliberately placed at the beginning of the article. It shows that as the Foresportia probability threshold rises, observed hit rate rises too across the main markets studied: 1X2, BTTS, Over 2.5 and Under 2.5.

Double Chance is also shown on this curve, but we discuss it later because it needs a specific reading: this market naturally covers two outcomes, which makes it less directly comparable with 1X2, BTTS or Over/Under. See the dedicated Double Chance section.
3. A deliberately difficult window: May and June 2026
The study covers two months of data: May and June 2026. This was not a comfortable period chosen to flatter the model. On the contrary, it mixes several difficult contexts for any football prediction system:
- international friendlies, often more unstable than club matches: rotations, tactical tests, variable motivation and less predictable lineups;
- the 2026 World Cup, with a very specific national-team context, sometimes large quality gaps, but also high-pressure matches;
- late-season league matches, a noisy period with relegation battles, qualification stakes, rotations, fatigue and often more surprises than in the middle of the season.
This context matters. If the goal were to create an easy marketing result, a cleaner window would be preferable. Here, it is the opposite: testing the model in a heterogeneous and imperfect period makes the benchmark more credible. If robust segments still emerge despite the noise, they deserve attention.
4. Method: comparing probabilities with pre-match odds
This analysis is based on historical pre-match odds snapshots. To avoid live-information bias, comparisons were recalculated from the last available price before each match, without using any information known after kick-off.
- T-2h: last available odds no later than two hours before kick-off.
- T-24h: last available odds no later than twenty-four hours before kick-off.
Two price universes were studied:
- Best odds across all bookmakers: the broadest possible view, useful to measure theoretical potential if a user compares several bookmakers.
- Best odds on Bet365 + Unibet: a stricter view, closer to mainstream user behaviour.
The simulations use a fixed €1 stake per pick. The objective is not to promise automatic profit, nor to claim that every signal should be played. The objective is more precise: identify where the relationship between estimated probability / available odds becomes favourable, then understand which markets and filters produce the cleanest signal.
This nuance is essential: a good prediction model can be excellent probabilistically while being valuable only on selected segments. Odds add an extra constraint. That is why reading the results through value, badges and markets is more useful than a broad “model versus bookmaker” statement.
5. What to remember in one minute
Fast reading. Foresportia is already strong in calibration; the bookmaker benchmark is used to identify where that signal becomes actionable as value.
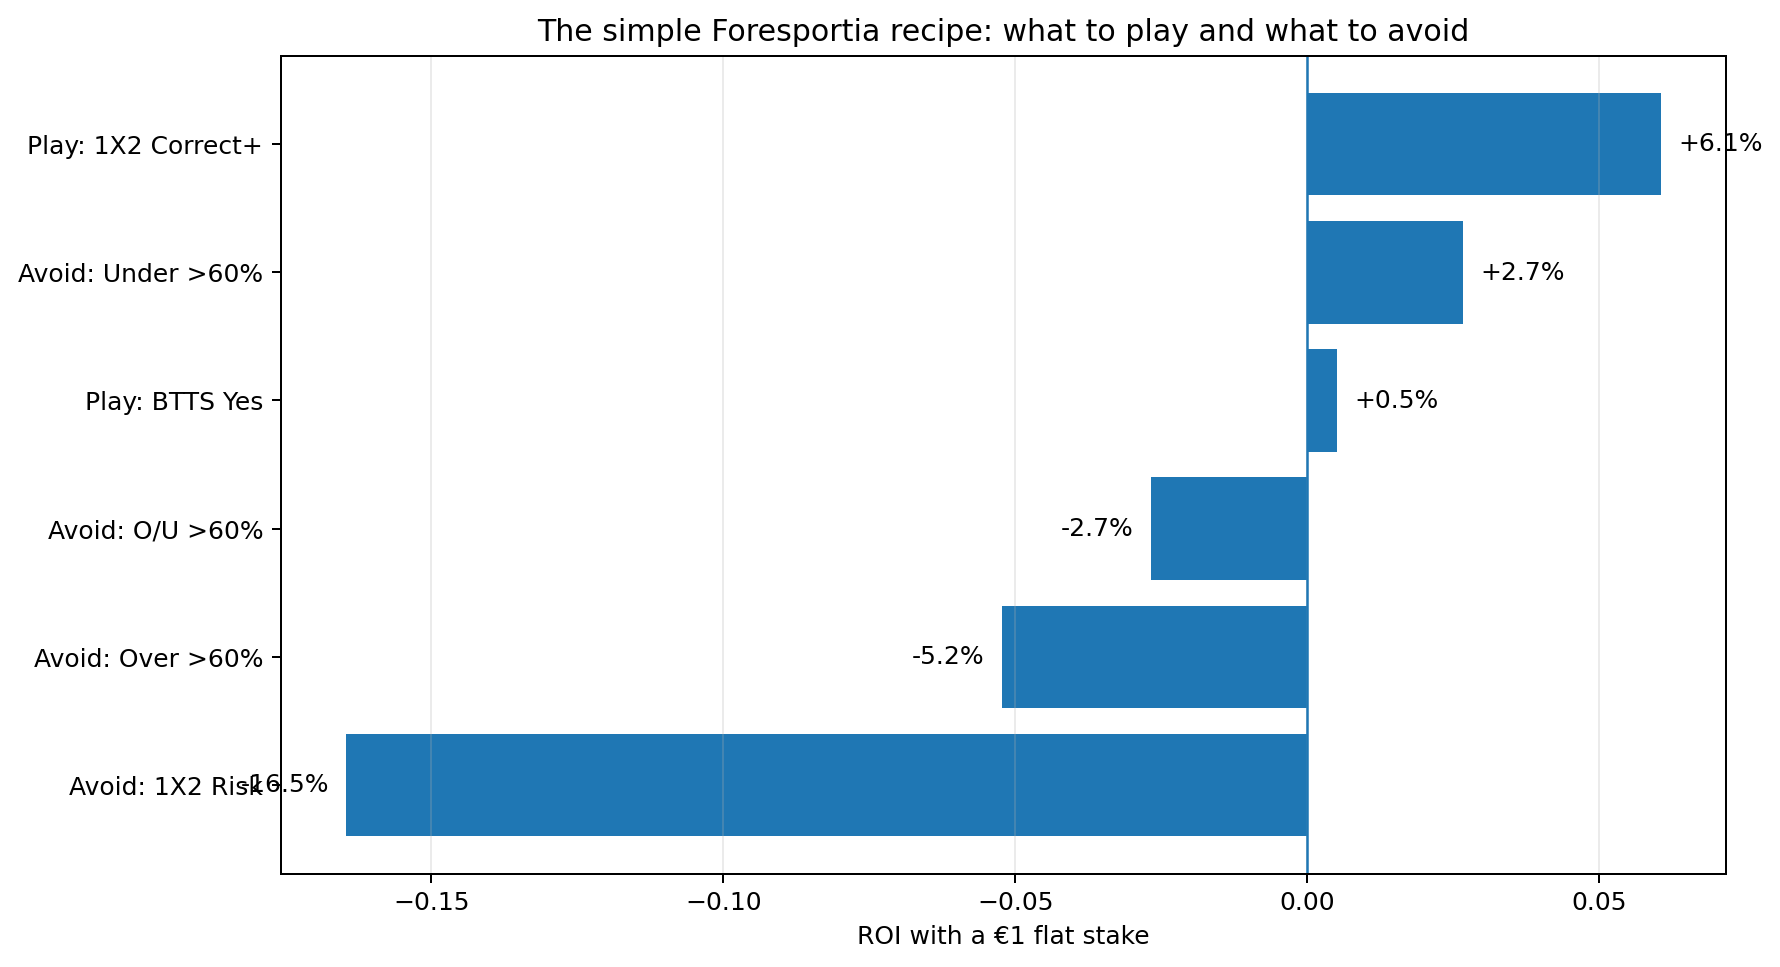
- Prioritize: BTTS Yes Highly filtered Double Chance 1X2 Correct+ 1X2 Stable+ 1X2 Ultra stable
- Monitor: Under 2.5 when strong value is detected
- Avoid in the core recipe: Unfiltered 1X2 BTTS No Over 2.5 Over/Under 2.5 played too broadly
6. Why these results are already very strong
The benchmark here is not an abstract dataset: it is the pre-match bookmaker market. That is a difficult opponent, because odds already aggregate a lot of information: historical data, injuries, recent form, betting volume, market adjustments and bookmaker margin.
In this context, obtaining spectacular ROI on every match would be unrealistic. It would even be suspicious. What really matters is the model's ability to sort:
- identify matches where its probability adds signal beyond the available price;
- filter cases where a predictive signal exists but is not paid enough by the odds;
- and, most importantly, say when not to play, even when the prediction looks intuitively attractive.
This is precisely where Foresportia shows its value: stability badges filter the noise, and some markets emerge much more cleanly than others. This is healthier than saying “the model beats bookmakers everywhere”. The real product advantage lies in selection.
7. Against bookmakers: where does Foresportia really stand?
Once calibration is established, the question becomes more ambitious: does the model still add something against pre-match odds? To ground that comparison, we added a simple benchmark: which bookmaker is most often right on its own 1X2 favourite?
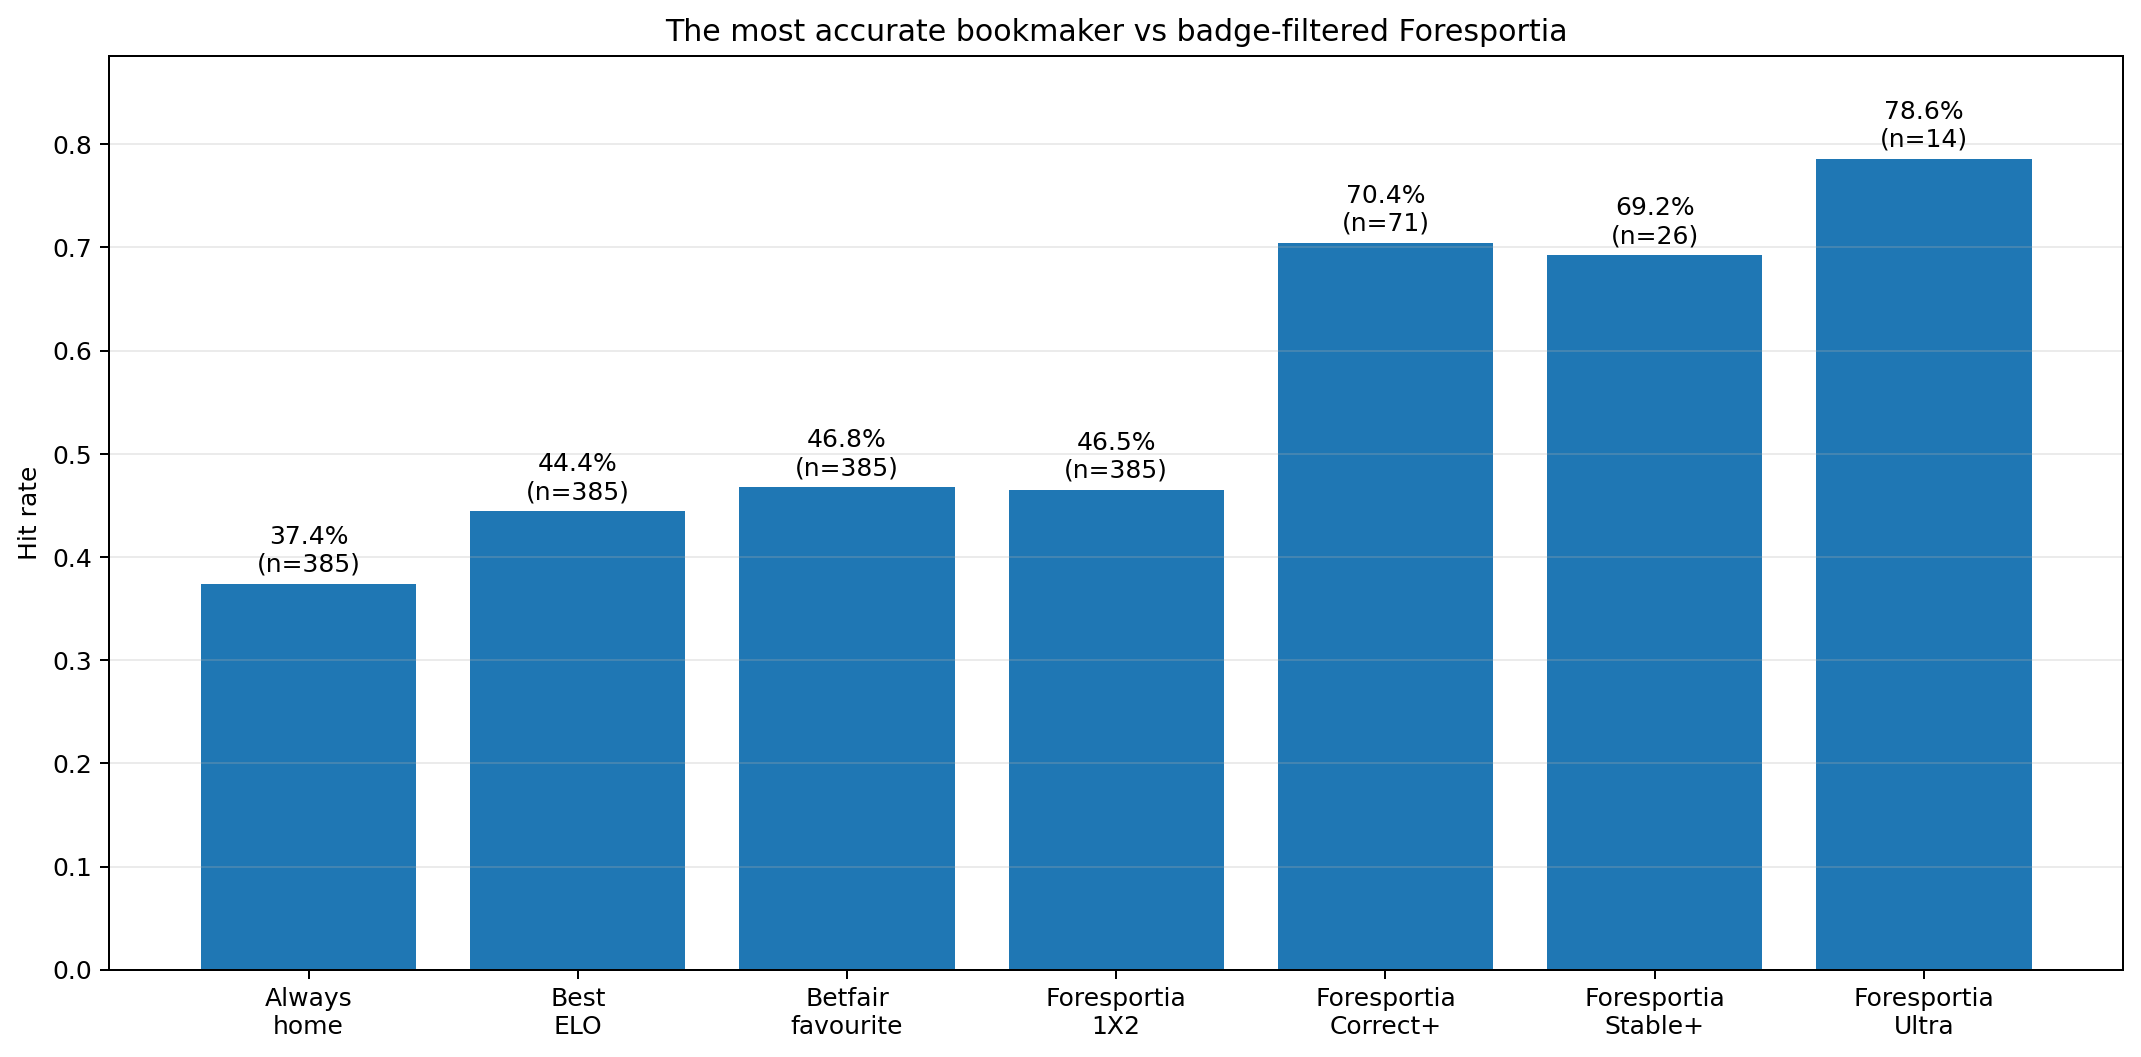
On this T-2h pre-match sample, the most accurate bookmaker is not Bet365, but Betfair, with 46.8% accuracy on its 1X2 favourite.
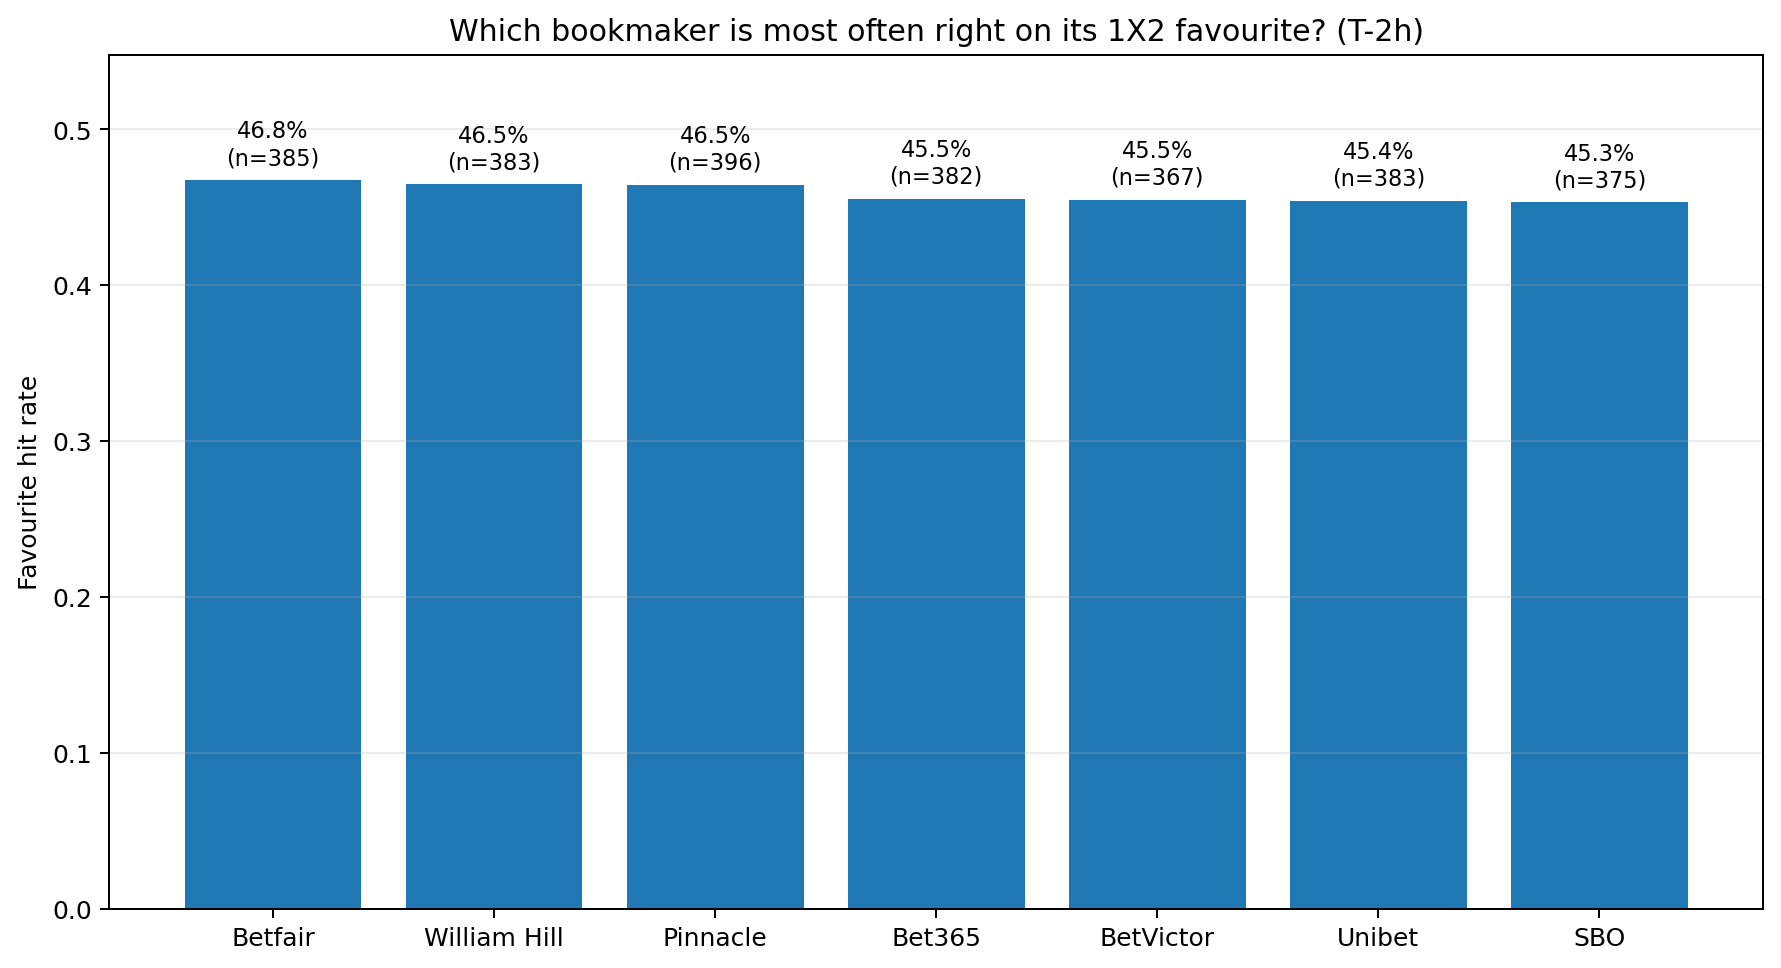
Once this benchmark is identified, Foresportia can be compared not to an arbitrary bookmaker, but to the most accurate bookmaker in the sample.
8. 1X2 market: the right use case is filtering
Raw 1X2 is not the best way to exploit the model, because it mixes very different matches: clear favourites, balanced games, late-season situations, national teams and noisier contexts. But once Foresportia is allowed to self-filter through its badges, the reading changes substantially.
| 1X2 segment | Best all books T-2h | Best all books T-24h | Reading |
|---|---|---|---|
| All 1X2 picks | -8.7% | -7.2% | Raw 1X2 is not the right entry point. |
| Correct or better | +7.8% | +8.4% | The model starts producing real value. |
| Stable or better | +5.5% | +9.6% | Stronger signal, but rarer. |
| Ultra stable | +25.6% | +34.7% | Very strong signal, but on small volume. |
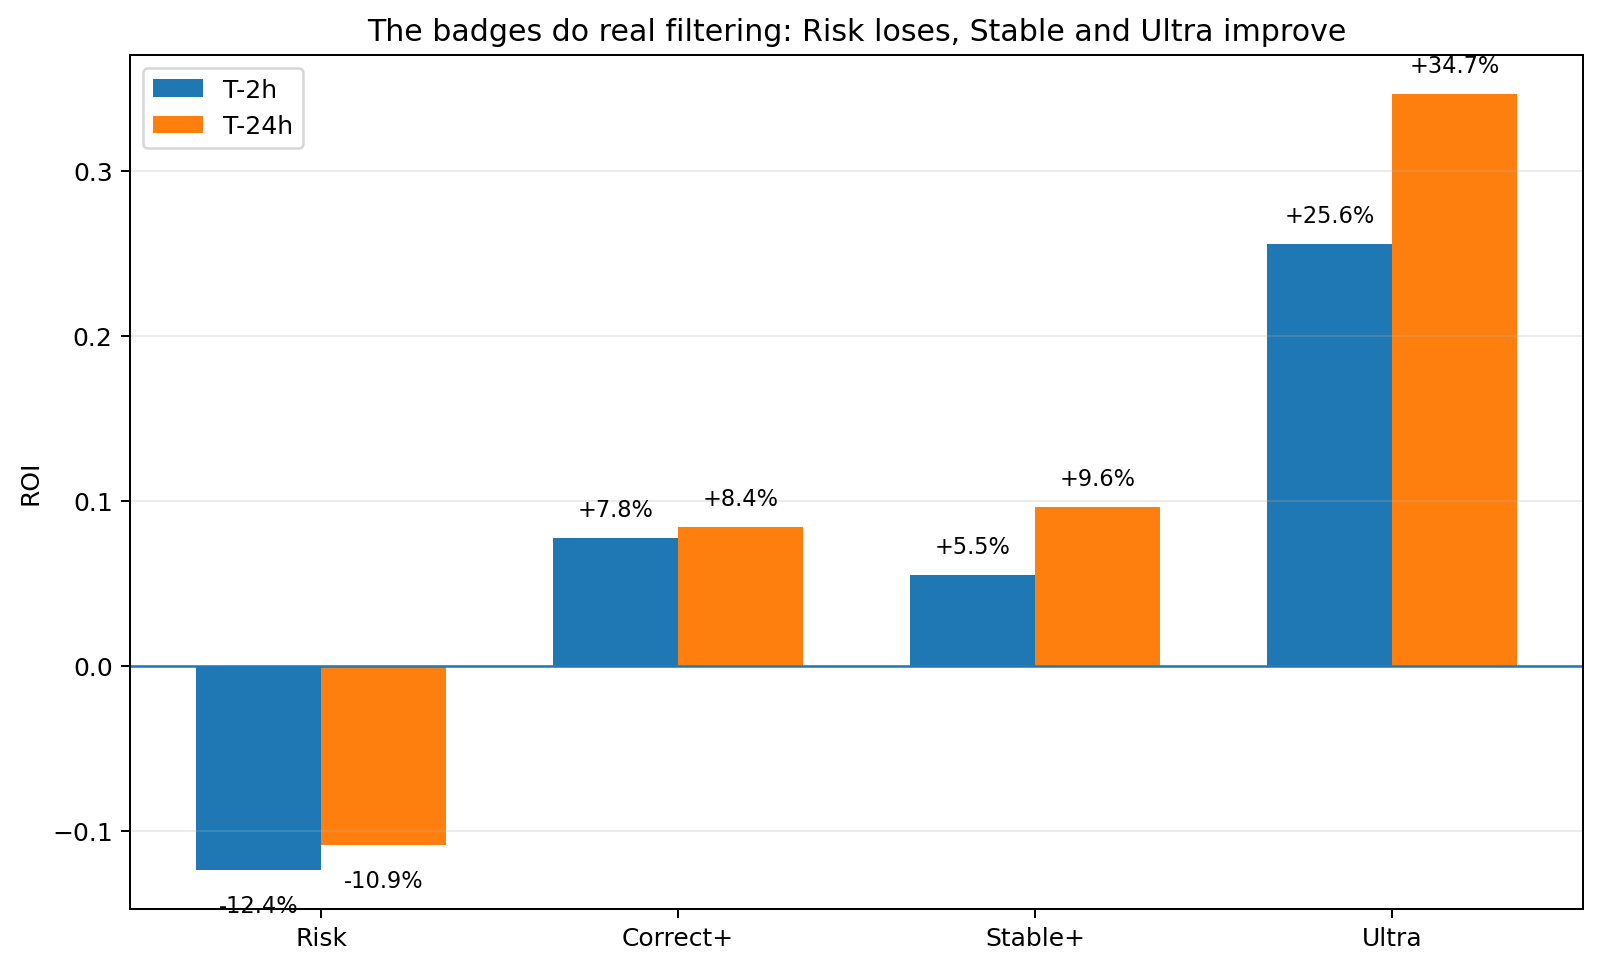
1X2 conclusion. The model is not meant to play every match on 1X2. It becomes much more relevant when the focus is narrowed to Correct, Stable and Ultra stable picks. This is the logic to emphasize: value comes from filtering, not from raw volume.
9. Double Chance: the stabilizing signal we should not ignore
Double Chance deserves its own place in the analysis. Played too broadly, it is not necessarily attractive: odds are low and the bookmaker margin leaves very little room for error. But when it is very strongly filtered by Foresportia, it becomes a useful portfolio component.
The role of Double Chance is not to generate the biggest single-ticket returns. Its value is different: it adds volume, stability and a slightly positive return when the model detects a very high probability.
- 1X if Foresportia probability ≥ 80.5%
- X2 if Foresportia probability ≥ 82.5%
- 12 excluded for now, because the signal was less clean in this backtest
| Segment | Bets | Hit rate | ROI | Net profit | Reading |
|---|---|---|---|---|---|
| Filtered Double Chance | 91 | 90.1% | +3.9% | +€3.53 | Stable, frequent and positive despite low average odds. |
This matters: with average odds around 1.15, the signal needs to win roughly 87% of the time just to break even. Here, the filtered signal reaches about 90% hit rate. The edge is less spectacular than filtered BTTS Yes, but it is valuable because it adds a defensive layer to the portfolio.
10. BTTS market: the cleanest segment
The Both Teams To Score (BTTS) market, and especially BTTS Yes, stands out as the cleanest signal in the study. This is interesting because BTTS is more readable than exact score prediction, while often being more editorially stable than a broad Over/Under approach.
| BTTS segment | Best all books T-2h | Best all books T-24h | Reading |
|---|---|---|---|
| BTTS Yes | +0.9% | +1.0% | Clean overall signal, already usable. |
| BTTS Yes against market lean | +11.1% | +4.7% | The best observed signal. |
| BTTS No | Negative | Negative | Less robust, not kept in the core recipe. |
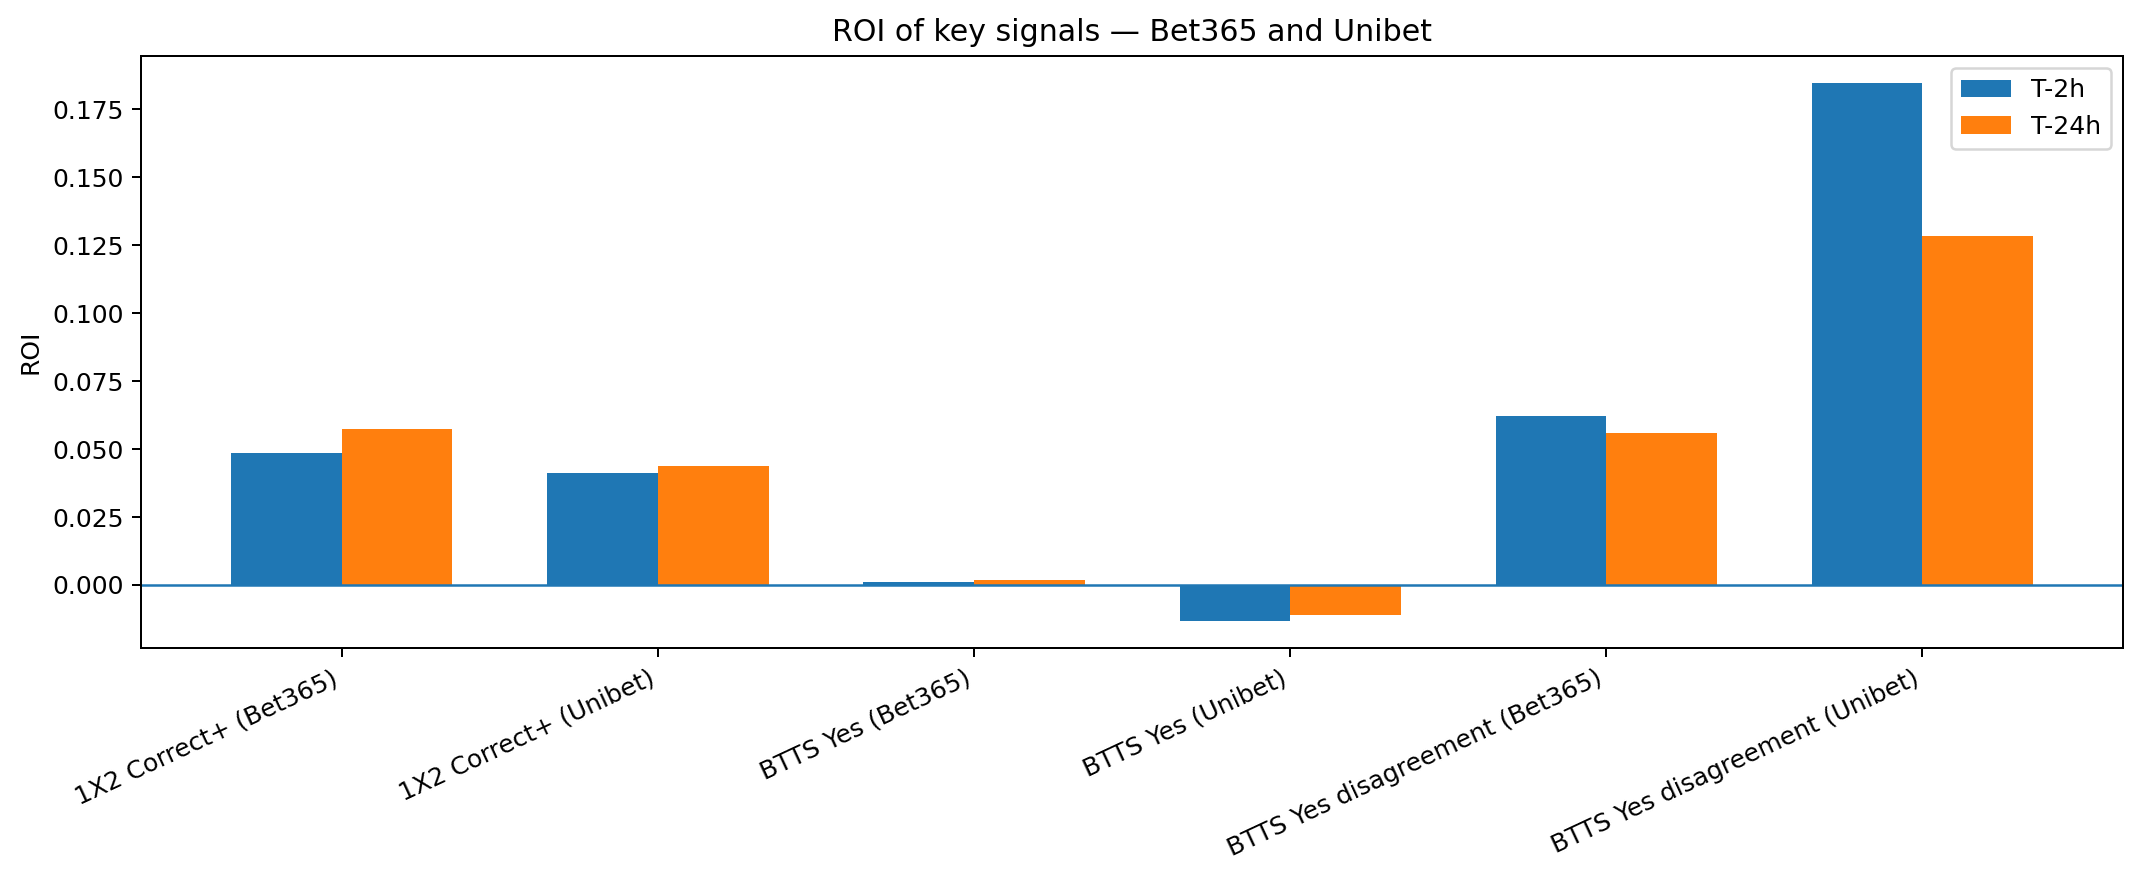
Suggested minimum threshold for BTTS. The BTTS Yes signal is already good as it stands. For a more cautious approach, a confidence threshold around 55% is a reasonable editorial rule. It avoids diluting the signal with matches where the model is too hesitant.
11. Over / Under 2.5 market: useful, but only under strong value
The BTTS and Over/Under goals market deserves attention because many users care about it. But the analysis shows that it is harder to convert into a regular edge than BTTS Yes or badge-filtered 1X2.
This does not mean the model is bad on goals. The calibration curve shows the opposite: there is a signal. The issue is subtler: on some markets, predictive signal is not always enough to compensate for the price offered by the odds. That is exactly the difference between “being right often” and “having positive value”.
| Over/Under 2.5 segment | Summary reading |
|---|---|
| Over 2.5 | Hit rate can look decent, but the odds do not pay enough. Not kept in the core recipe. |
| Under 2.5 | More interesting than Over on some sub-segments, but not yet stable enough for a broad recommendation. |
| Recommended approach | Only play this market when strong value is detected, with an exploratory preference for Under 2.5. |
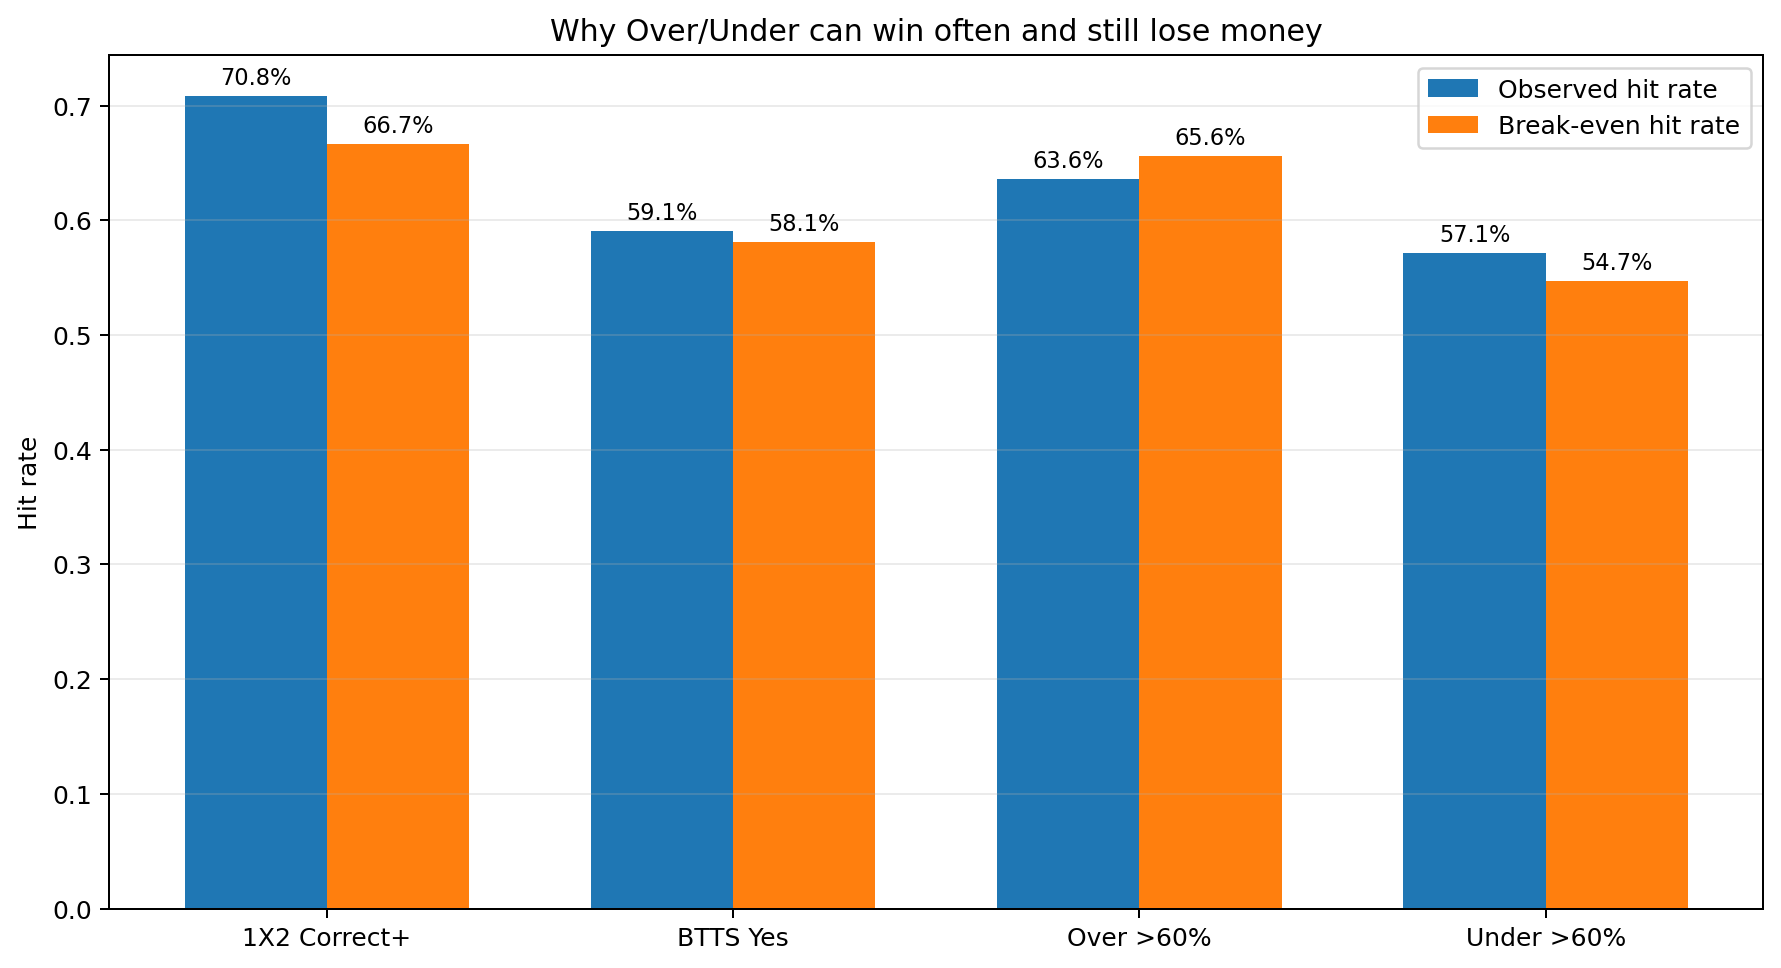
Suggested threshold on goals markets. For an honest marketing and product message, the right framing is:
- BTTS Yes remains the goals-related market to prioritize.
- Under 2.5 can be monitored when detected value is strong, ideally with confidence around 55–60% minimum.
- Over 2.5 should not be presented as a premium signal at this stage.
12. The best simple recipe observed
For a non-expert reader, the cleanest observed combination is:
1X2 Correct+ + BTTS Yes
Why this recipe? Because it removes noise:
- it keeps 1X2, but only when badges indicate a real level of stability;
- it keeps BTTS, but only on the most robust side: Yes;
- it avoids adding an Over/Under market that is still too irregular.
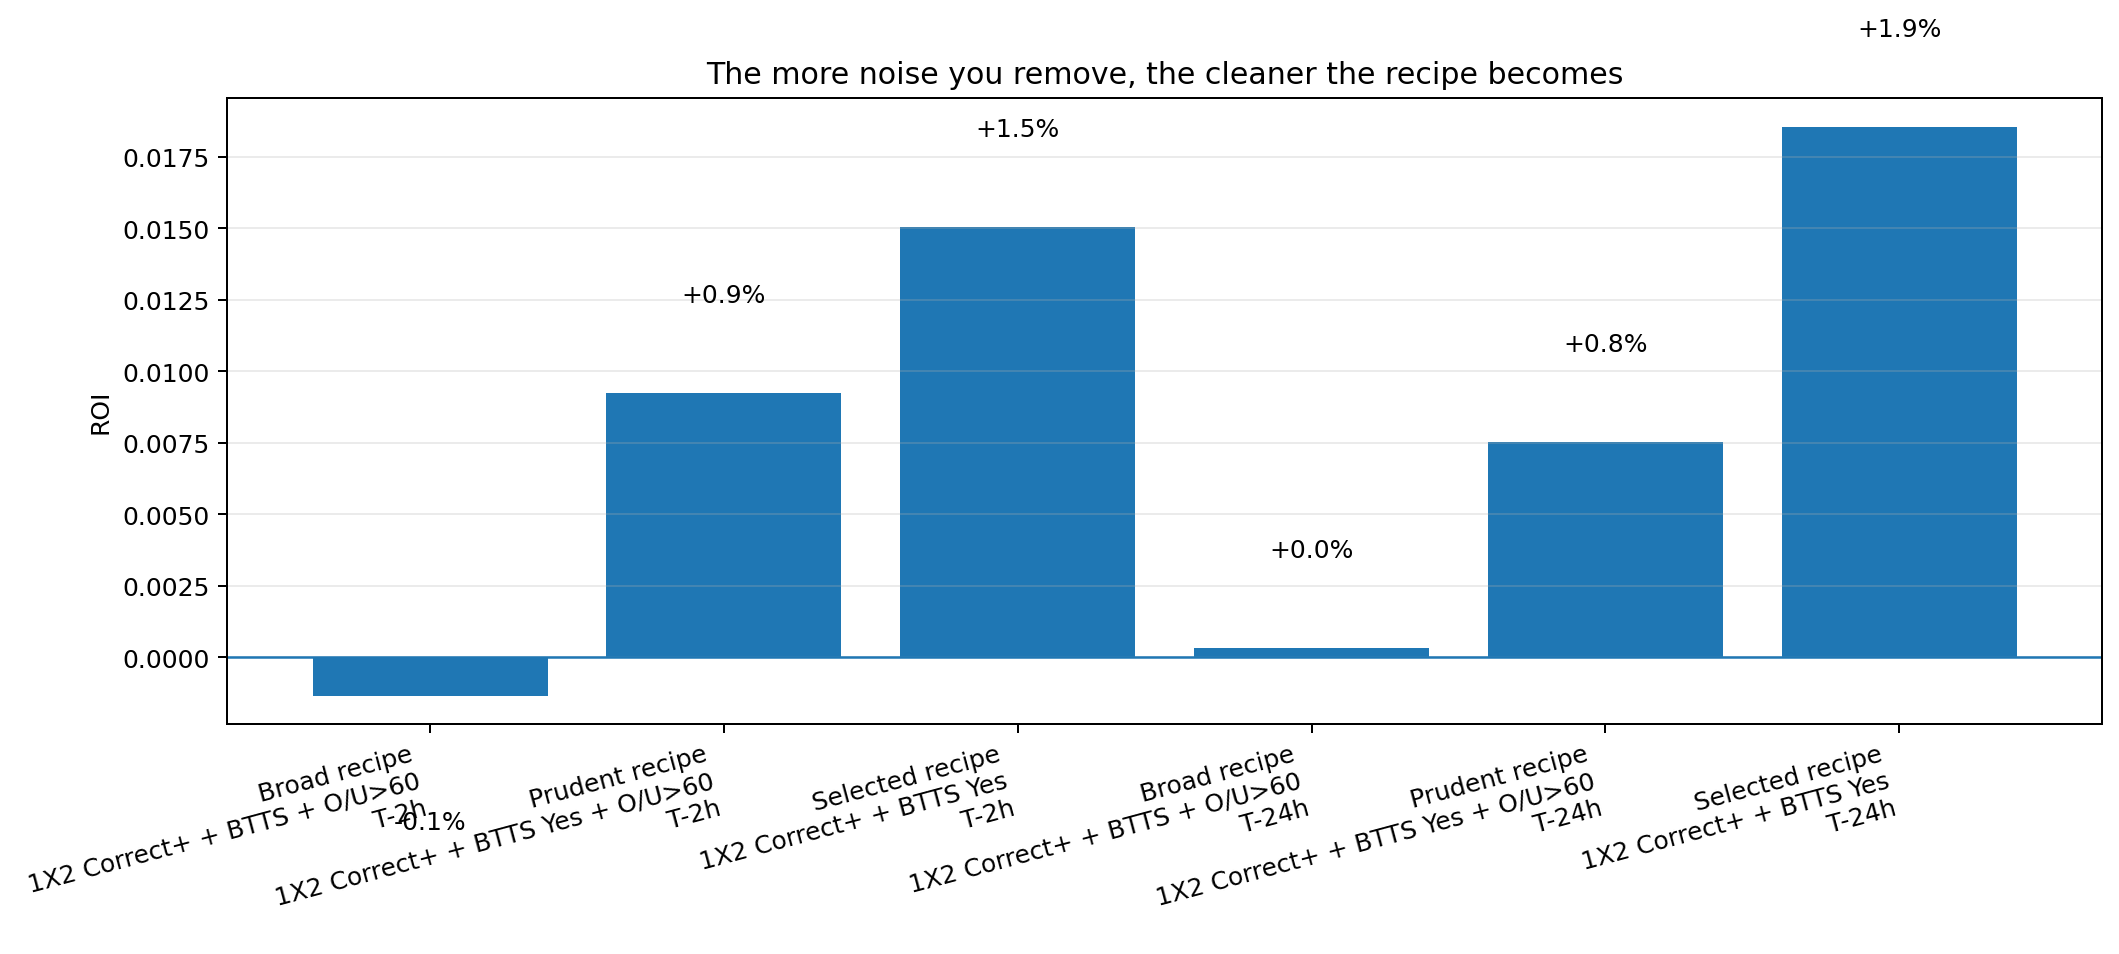
| Portfolio | Best all books T-2h | Best all books T-24h | Bet365 + Unibet T-2h | Bet365 + Unibet T-24h |
|---|---|---|---|---|
| 1X2 Correct+ + BTTS Yes | +2.16% | +2.38% | +1.50% | +1.85% |
Final portfolio with Double Chance
By adding highly filtered Double Chance, the portfolio becomes more complete. It is no longer only about playing 1X2 and BTTS Yes; it also adds a defensive signal that helps stabilize the curve.
- 1X2: Correct+ only
- Double Chance: 1X ≥ 80.5% or X2 ≥ 82.5%, 12 excluded
- BTTS: Yes ≥ 64%
- Under 2.5: ≥ 54%
- Over 2.5: excluded from the final portfolio
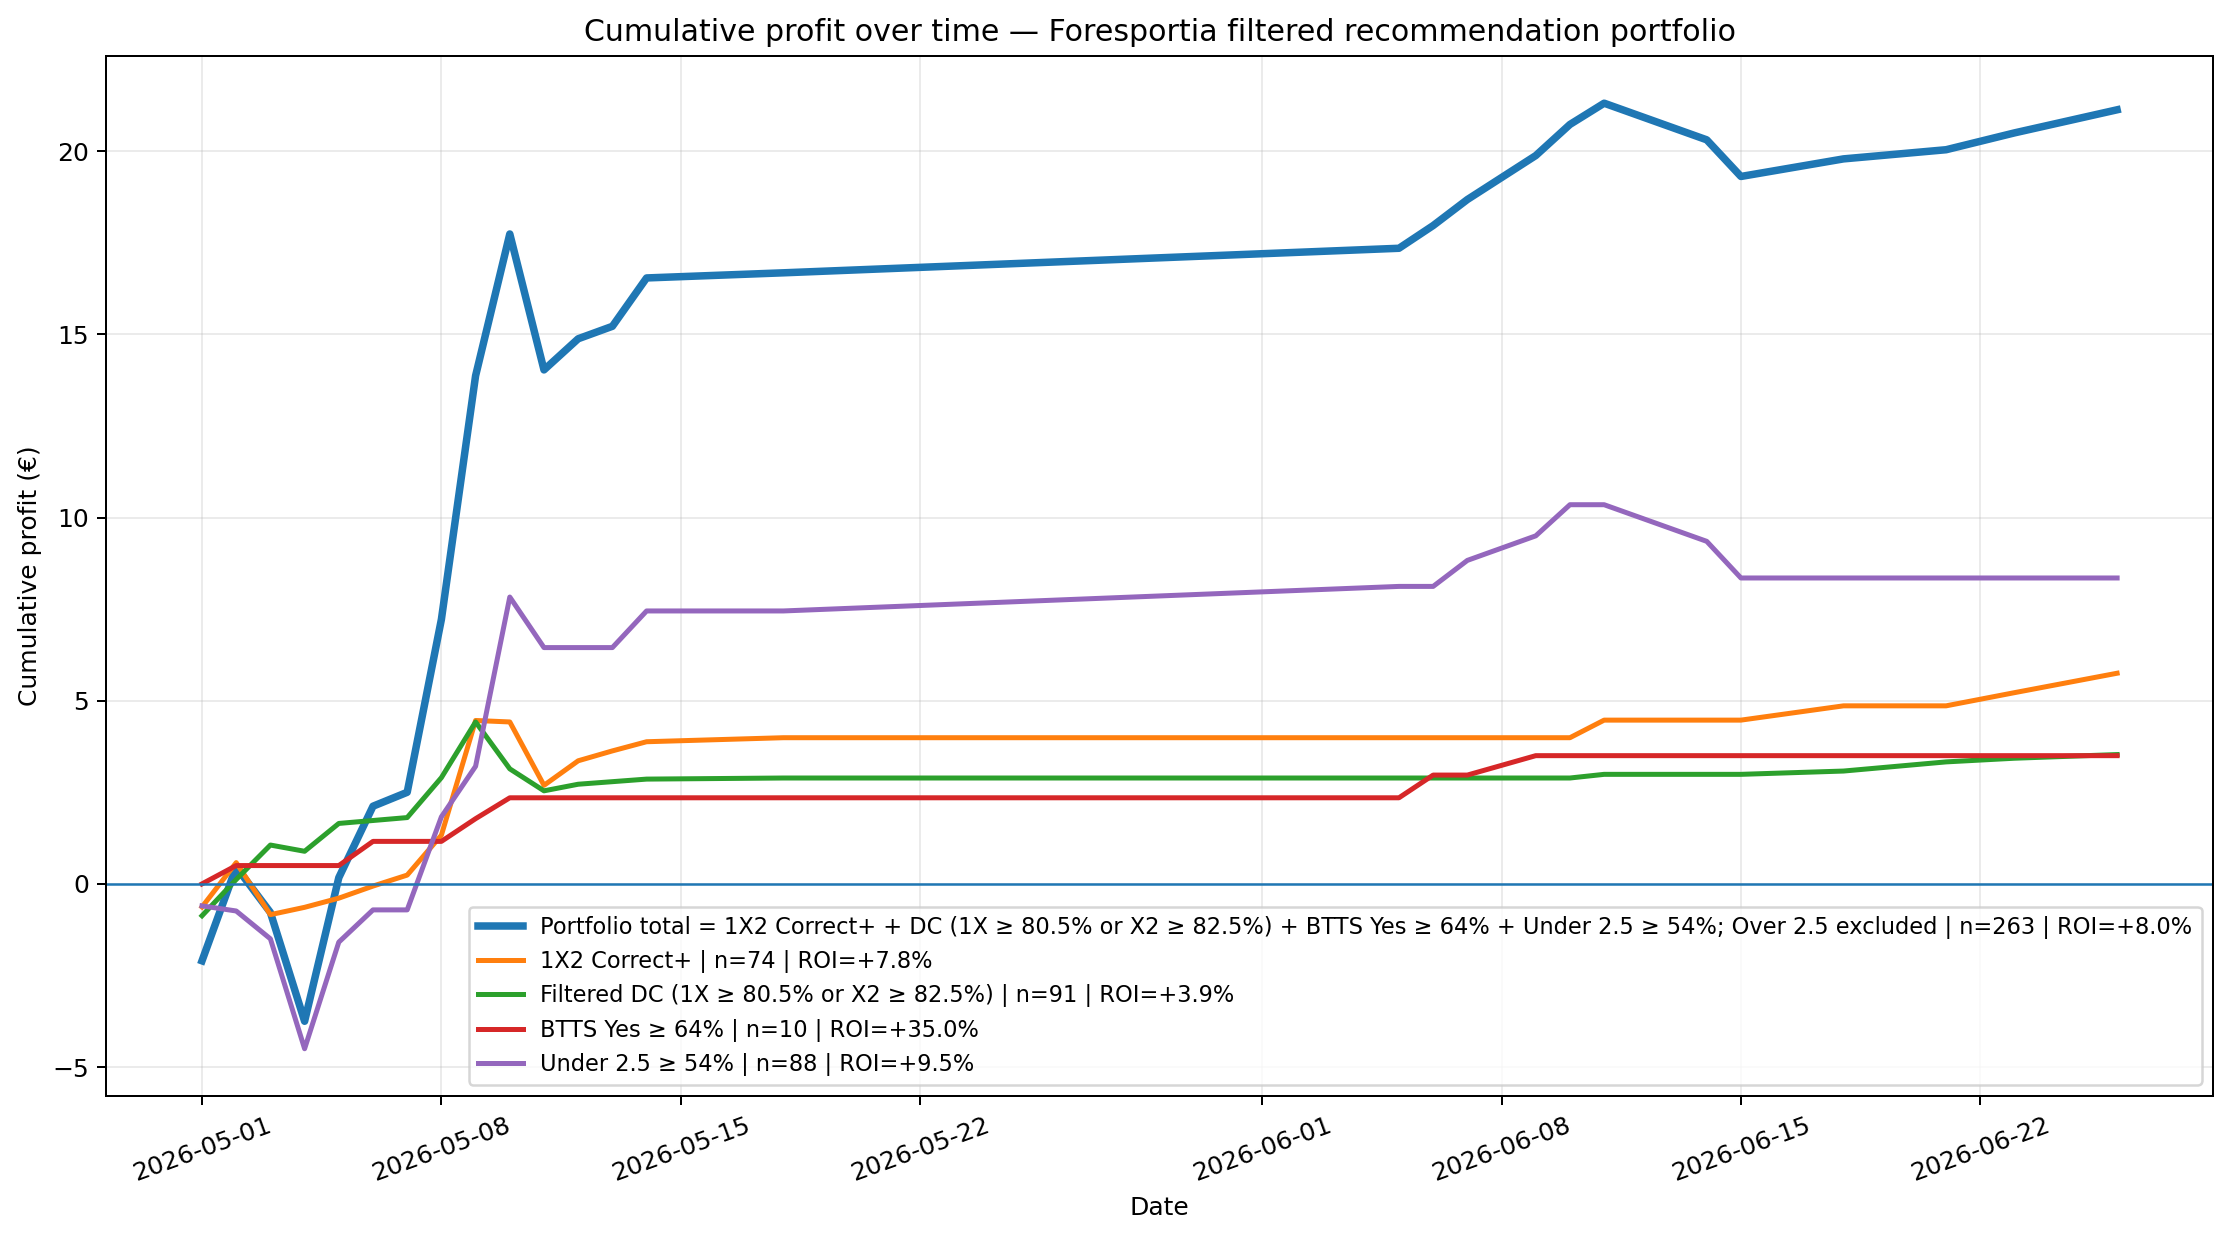
| Component | Bets | Hit rate | ROI | Net profit |
|---|---|---|---|---|
| 1X2 Correct+ | 74 | 71.6% | +7.8% | +€5.75 |
| Filtered Double Chance | 91 | 90.1% | +3.9% | +€3.53 |
| Filtered BTTS Yes | 10 | 90.0% | +35.0% | +€3.50 |
| Filtered Under 2.5 | 88 | 60.2% | +9.5% | +€8.35 |
| Portfolio total | 263 | 74.9% | +8.0% | +€21.13 |
The recipe becomes actionable when it is connected to available odds. Premium Odds Insights displays the gap between Foresportia probabilities and bookmaker prices to identify matches where value is actually present.
13. What this benchmark really shows
This benchmark does not show that Foresportia “beats bookmakers everywhere”. That would be too broad, and therefore not very credible. The important result is more precise: Foresportia becomes interesting when it filters its own signals.
The value of the model therefore does not come from a promise of certainty. It comes from its ability to help sort matches: identify signals that are stable enough, detect cases where the available odds leave room for value, and avoid markets where the price does not compensate enough for the risk.
In practice, Foresportia should be read as a decision-support tool: it combines probability, stability, market context and value to identify the most interesting situations, without turning every prediction into an automatic recommendation.
14. Conclusion
Foresportia is not a tool that automatically turns every match into a bet. And that is precisely what creates its value: it helps select.
- The model is already solid upstream: its calibration shows that confidence levels are informative.
- On 1X2, badges are effective and make the signal much stronger than raw 1X2.
- On BTTS, especially BTTS Yes, the model currently delivers one of its cleanest signals.
- On Double Chance, the signal becomes useful when it is highly filtered, especially on 1X and X2.
- On Over/Under 2.5, the model sees something, but regular conversion into value is more demanding; this market should remain limited to cases of strong detected value.
Simple recipe to remember: prioritize BTTS Yes, highly filtered Double Chance and 1X2 Correct / Stable / Ultra stable, while keeping Under 2.5 as a monitored option only under strong value conditions.
Top reads for today
Move from model analysis to practical pages for reading matches, odds and today's value signals.
- Compare matches by date
- Explore available leagues and matches
- Read more Foresportia football analytics articles