
Framing
Here, “curse” means a very long and statistically rare streak. The goal is not folklore: it’s to understand what data can explain, and more importantly what an AI model should not learn.
A real streak… and a classic analysis trap
For more than four decades, Olympique de Marseille did not win away at Bordeaux in the league. It’s the archetype of a storyline that triggers “irrational” interpretation: superstition, destiny, pressure…
Yet the useful question is simpler: is it a stable signal (learnable by a model) or an artefact (variance + context, therefore dangerous to overweight)?
The phenomenon: a multi-generation streak
A long streak is not just a chain of results: it’s an accumulation of contexts. It spans multiple football eras, multiple styles, and many different squads.
- Matches spread over long periods (strong non-stationarity)
- Manager changes and shifting team dynamics
- Narrative effect: the more famous the streak, the more it weighs
Statistically, the streak is rare. But rare does not mean “a law.”
Why it is statistically striking (without going mystical)
In a simplified model (similar strengths, stable home advantage, near-independent matches), such a streak sits far in the tail of the distribution.
But that simplified model is precisely what breaks in real football:
- football changes fast (styles, intensity, refereeing, preparation),
- perception shapes strategy (conservatism, fear of “breaking” the streak),
- media pressure becomes a contextual factor that is rarely measured.
In other words: a streak can emerge through variance, then be reinforced by context.
False leads: what simple variables do not explain
A healthy data reflex is to test “easy” explanations: weather, attendance, average age, internationals, discipline… In this case, those variables do not yield a robust and stable explanation.
That matters: if classic mechanical causes do not show up, then the explanation (if any) is likely contextual or cognitive.
The key point: asymmetry (who is actually “breaking down”?)
The most interesting signal is not “Bordeaux overperforms,” but rather: Marseille underperforms vs Bordeaux, compared to its season baseline and its performance against comparable opponents.
This framing changes everything:
- We stop looking for “Bordeaux magic.”
- We measure a relative underperformance from Marseille.
- We move toward plausible mechanisms: pressure, narrative, more cautious strategy, etc.
Chart 1 — OM’s attacking output in Bordeaux, compared to its season away baseline
This chart compares, for each season, the goals scored by Olympique de Marseille in their away match at Bordeaux to their average away goals in the same season.
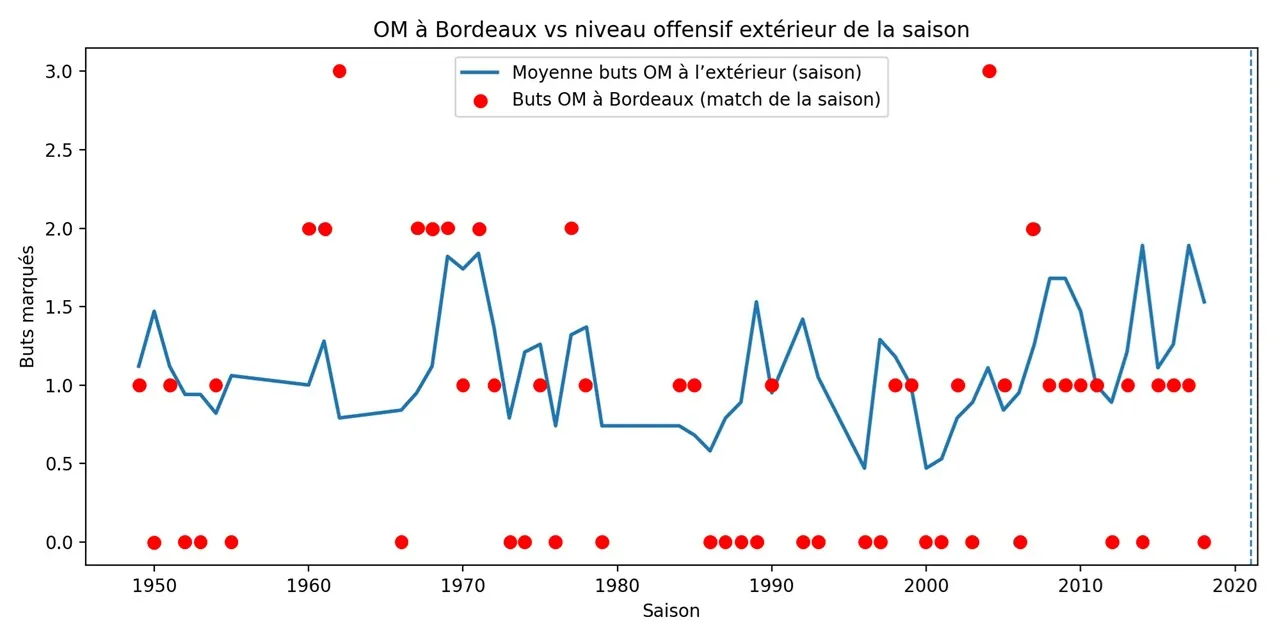
Reading: when OM’s Bordeaux output sits consistently below its typical away attacking level, it suggests a recurring contextual underperformance, without relying on raw cumulative head-to-head history.
The classic trap: confusing repetition with explanation
When a streak is long, the natural reflex is to hunt for a “strong” cause: a tactical mismatch, a cursed stadium, a special kind of pressure. Yet repetition alone does not turn an event into a law.
In data terms, the bias is familiar: the longer a streak gets, the more we tend to over-interpret it, even when the underlying mechanisms are weak or unstable.
That is exactly how raw head-to-head history can mislead a predictive model when injected without safeguards.
Premier League “curses” exist too (Tottenham–Chelsea, and others)
The Bordeaux–Marseille case is used here as a documented case study, but the underlying mechanisms apply to many so-called “curses” observed in other leagues — including the Premier League.
Tottenham–Chelsea, for instance, has often been framed as a symbolic streak (especially in the early Tottenham Hotspur Stadium years). Whether the narrative is fully justified is not the point here: the key lesson is that long streaks can look meaningful, while often collapsing once you recontextualise performance season by season.
In short: famous streaks are great storytelling — and a great stress test for any serious model.
The end of the streak: a real-world stress test
On January 7, 2022, Marseille finally won in Bordeaux. The most instructive part is not “the match,” but what the break suggests:
- symbolic pressure drops,
- the rare event stops shaping the narrative,
- matchups drift back toward a more ordinary distribution.
A structural signal rarely disappears so cleanly. A contextual one often can.
Chart 2 — Cumulative “matches without a win” (clear break in 2022)
A deliberately simple chart: a counter that rises match by match, then breaks sharply when the streak ends.
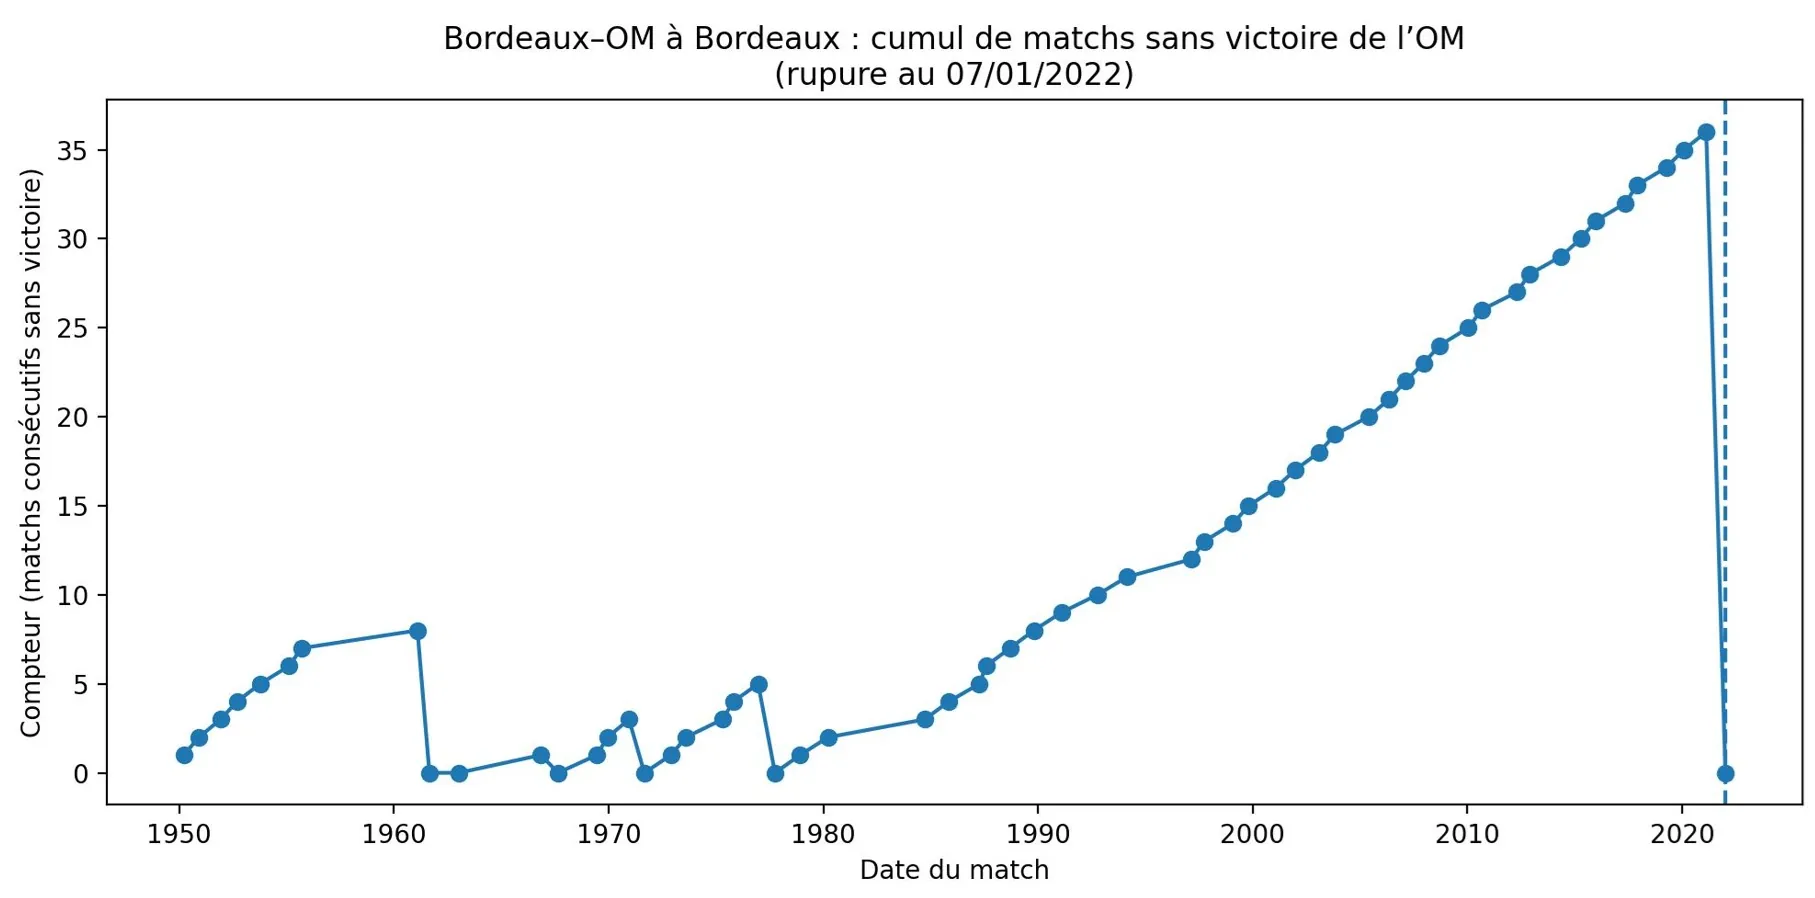
Reading: this is the most “general audience” illustration, but it must be paired with the asymmetry lens — otherwise we fall back into the raw H2H trap.
What this changes for AI models (and why raw H2H is dangerous)
The classic failure mode: making head-to-head (H2H) a dominant feature, even though it mixes incomparable eras and amplifies artefacts.
A robust model does the opposite:
- Time weighting: football changes; eras do not simply add up.
- Regularisation: a rare streak should not create overconfidence.
- Lower confidence: when the signal is unstable or unexplainable, display more uncertainty.
This is exactly the kind of case where the goal is not to “predict the streak,” but to prevent the streak from distorting how probabilities are interpreted.
Conclusion
Football “curses” do exist in data: rare streaks happen, sometimes over decades. But their existence alone does not make them a reliable, learnable signal.
Bordeaux–Marseille is a perfect illustration: a real, impressive streak — yet fragile once you recontextualise it season by season and avoid the raw head-to-head trap.
For prediction models, the lesson is simple: what captures attention is not always what should influence probabilities. Robustness comes from regularisation, contextualisation… and sometimes accepting that a streak does not have to be “explained.”
Quick FAQ
How should I read a probability on Foresportia?
A probability is an expected frequency, not a certainty for a single match.
Why does reliability matter?
Reliability shows how similar probabilities performed in historical data.
Does Foresportia promise an outcome?
No. The website provides probabilistic match reading and context, without guaranteed results.
Top match readings today
Continue with practical pages to read today's matches.
See today's match reading