 Probar ahora en Google Colab
Crea un panel de fútbol en Python
Un recorrido guiado, del cliente autenticado a los tres gráficos, con código corto y copiable en cada paso y el script completo para descargar.
1 Resultado final
Crea un panel de fútbol con los próximos partidos, los mercados disponibles y el historial verificado de tu competición.
Vas a producir, en local, tres vistas a partir de una sola competición:
- una tabla de probabilidades 1X2 con el pick principal y su confianza;
- los mercados BTTS, Over/Under, doble oportunidad y DNB cuando la respuesta los contiene;
- historial verificado con el acierto acumulado del pick publicado antes del partido.
El recorrido principal usa solo dos llamadas a la API cuando FORES_LEAGUE_CODE está configurado: una para los próximos partidos y otra para el historial.
2 Requisitos previos
Instala el SDK oficial y matplotlib. foresportia es el SDK Python oficial de la API; matplotlib solo se usa para las visualizaciones locales.
python -m pip install --upgrade foresportia matplotlib3 Añadir la clave API
Windows PowerShell (sesión actual):
$env:FORES_API_KEY = "your_key"
$env:FORES_LEAGUE_CODE = "SUE"
Variable de Windows persistente:
[Environment]::SetEnvironmentVariable(
    "FORES_API_KEY",
    "your_key",
    "User"
)
macOS / Linux:
export FORES_API_KEY="your_key"
export FORES_LEAGUE_CODE="SUE"4 Inicializar el cliente
ForesportiaClient.from_env() lee la clave desde el entorno. El SDK gestiona la autenticación, las respuestas tipadas, las cuotas y los errores HTTP.
from foresportia import ForesportiaClient

client = ForesportiaClient.from_env()
5 Elegir la competición
Con una clave Developer, una sola competición está vinculada a la clave. Con Starter pueden ser accesibles varias competiciones. La función siguiente usa FORES_LEAGUE_CODE si existe y, si no, detecta la única competición accesible con list_leagues().
def choose_league(client: ForesportiaClient) -> str:
    """Use FORES_LEAGUE_CODE or detect the only accessible competition."""
    if LEAGUE_CODE:
        return LEAGUE_CODE.upper()

    leagues = client.list_leagues().data
    if len(leagues) == 1:
        return leagues[0].code
    if not leagues:
        raise RuntimeError("No competition is accessible with this key.")

    codes = ", ".join(league.code for league in leagues)
    raise RuntimeError(
        "Several competitions are accessible. "
        f"Set FORES_LEAGUE_CODE to one of: {codes}"
    )
6 Cargar los próximos partidos
Una sola llamada devuelve los próximos partidos de la competición. Aquí UPCOMING_DAYS es 14 y UPCOMING_LIMIT es 5.
upcoming_response = client.list_league_matches(
    league_code,
    include="upcoming",
    days=UPCOMING_DAYS,
    limit=UPCOMING_LIMIT,
)
Cada partido expone los campos que necesita el panel:
match.probabilities
match.pick
match.markets
match.confidence
7 Cargar el historial
El método dedicado list_league_history() devuelve el historial verificado de la competición. La ventana se adapta automáticamente al contrato.
history_response = client.list_league_history(league_code)
history = history_response.data- Developer: 7 días; Starter: hasta 31 días por petición sobre un entitlement de 90 días.
- Un periodo puede estar legítimamente vacío: es una respuesta normal, no un error.
- Las probabilidades y el pick son los publicados antes del partido.
- status="final" y result_score proporcionan el resultado verificado.
8 Evaluar el pick 1X2
Bastan dos funciones cortas: actual_outcome() convierte un marcador final en home/draw/away, y pick_is_correct() compara el pick publicado con el resultado verificado.
def actual_outcome(score: str | None) -> str | None:
    """Turn a final score such as '2-1' into home/draw/away."""
    if not score:
        return None
    try:
        home, away = map(int, score.split("-"))
    except ValueError:
        return None
    return "home" if home > away else "away" if away > home else "draw"


def pick_is_correct(match: MatchSummary) -> bool | None:
    """Compare the published 1X2 pick with the verified final score."""
    actual = actual_outcome(match.result_score) if match.is_final else None
    predicted = match.predicted_outcome
return None if actual is None or predicted is None else actual == predicted9 Construir los tres gráficos
Probabilidades 1X2
Objetivo: leer de un vistazo el reparto local / empate / visitante, el pick principal y la confianza.
Datos: match.probabilities, match.pick, match.predicted_outcome y match.confidence de los próximos partidos.
def plot_upcoming(league_name: str, matches: list[MatchSummary]) -> plt.Figure:
    """1X2 probabilities, main pick and confidence."""
    figure, axis = plt.subplots(figsize=(13, max(4.8, len(matches) * 0.9)))
    if not matches:
        axis.axis("off")
        axis.text(0.5, 0.5, "No upcoming published match.", ha="center", va="center")
        return figure

    y = list(range(len(matches)))
    home = [m.probabilities["home"] * 100 for m in matches]
    draw = [m.probabilities["draw"] * 100 for m in matches]
    away = [m.probabilities["away"] * 100 for m in matches]

    axis.barh(y, home, label="1 · Home")
    axis.barh(y, draw, left=home, label="X · Draw")
    axis.barh(y, away, left=[h + d for h, d in zip(home, draw)], label="2 · Away")
    axis.set_yticks(y, [f"{date_label(m)} · {m.home_team} – {m.away_team}" for m in matches])
    axis.set_xlim(0, 140)
    axis.set_xticks((0, 20, 40, 60, 80, 100))
    axis.set_xlabel("1X2 probability (%)")
    axis.set_title(f"{league_name} — upcoming matches")
    axis.grid(axis="x", alpha=0.25)
    axis.invert_yaxis()
    axis.legend(ncol=3, loc="upper center", bbox_to_anchor=(0.42, -0.12))

    for index, match in enumerate(matches):
        probability = (match.pick or {}).get("probability")
        probability_text = f"{probability:.0%}" if isinstance(probability, (int, float)) else ""
        axis.text(
            102,
            index,
            f"★ {match.predicted_outcome or 'no pick'} {probability_text} · {confidence_text(match)}",
            va="center",
            fontsize=9,
        )

    figure.tight_layout()
    return figure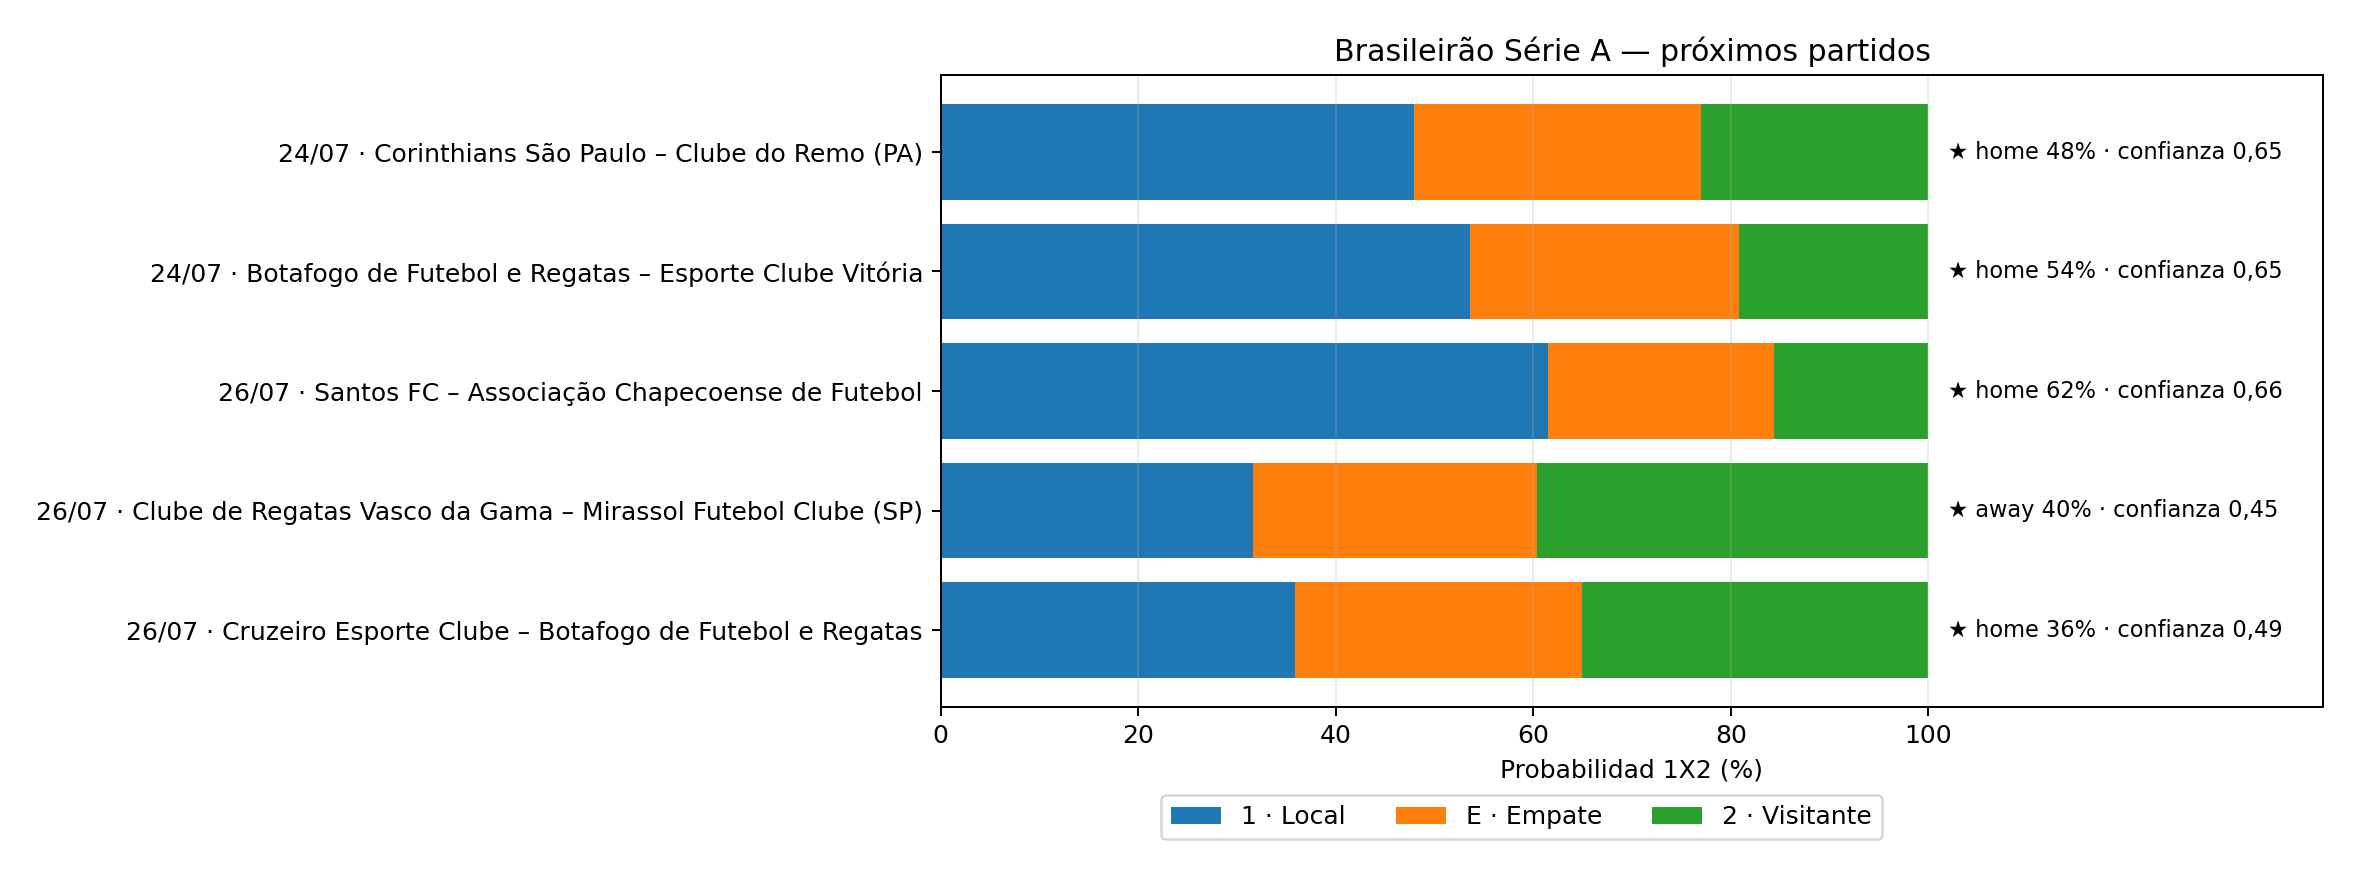
Lectura: una barra larga del lado local indica un favorito claro; el pick con estrella recuerda la elección publicada y su confianza.
Mercados disponibles
Objetivo: ver, como una matriz, los mercados realmente presentes en la respuesta.
Datos: match.markets, filtrado a las claves realmente devueltas (BTTS, Over/Under, doble oportunidad, DNB).
def plot_markets(league_name: str, matches: list[MatchSummary]) -> plt.Figure:
    """Matrix of the markets actually present in the response."""
    available = {key for match in matches for key in (match.markets or {})}
    columns = [(key, label) for key, label in MARKETS if key in available]
    figure, axis = plt.subplots(
        figsize=(max(10, len(columns) * 1.4), max(4.8, len(matches) * 0.9))
    )

    if not matches or not columns:
        axis.axis("off")
        axis.text(0.5, 0.5, "No additional market available.", ha="center", va="center")
        return figure

    matrix = [[(m.markets or {}).get(key, float("nan")) for key, _ in columns] for m in matches]
    image = axis.imshow(matrix, aspect="auto", vmin=0, vmax=1)
    axis.set_xticks(range(len(columns)), [label for _, label in columns])
    axis.set_yticks(range(len(matches)), [f"{m.home_team} – {m.away_team}" for m in matches])
    axis.set_title(f"{league_name} — available markets")

    for row_index, row in enumerate(matrix):
        for column_index, probability in enumerate(row):
            if probability == probability:  # NaN-safe
                axis.text(column_index, row_index, f"{probability:.0%}", ha="center", va="center")

    figure.colorbar(image, ax=axis, label="Probability")
    figure.tight_layout()
    return figure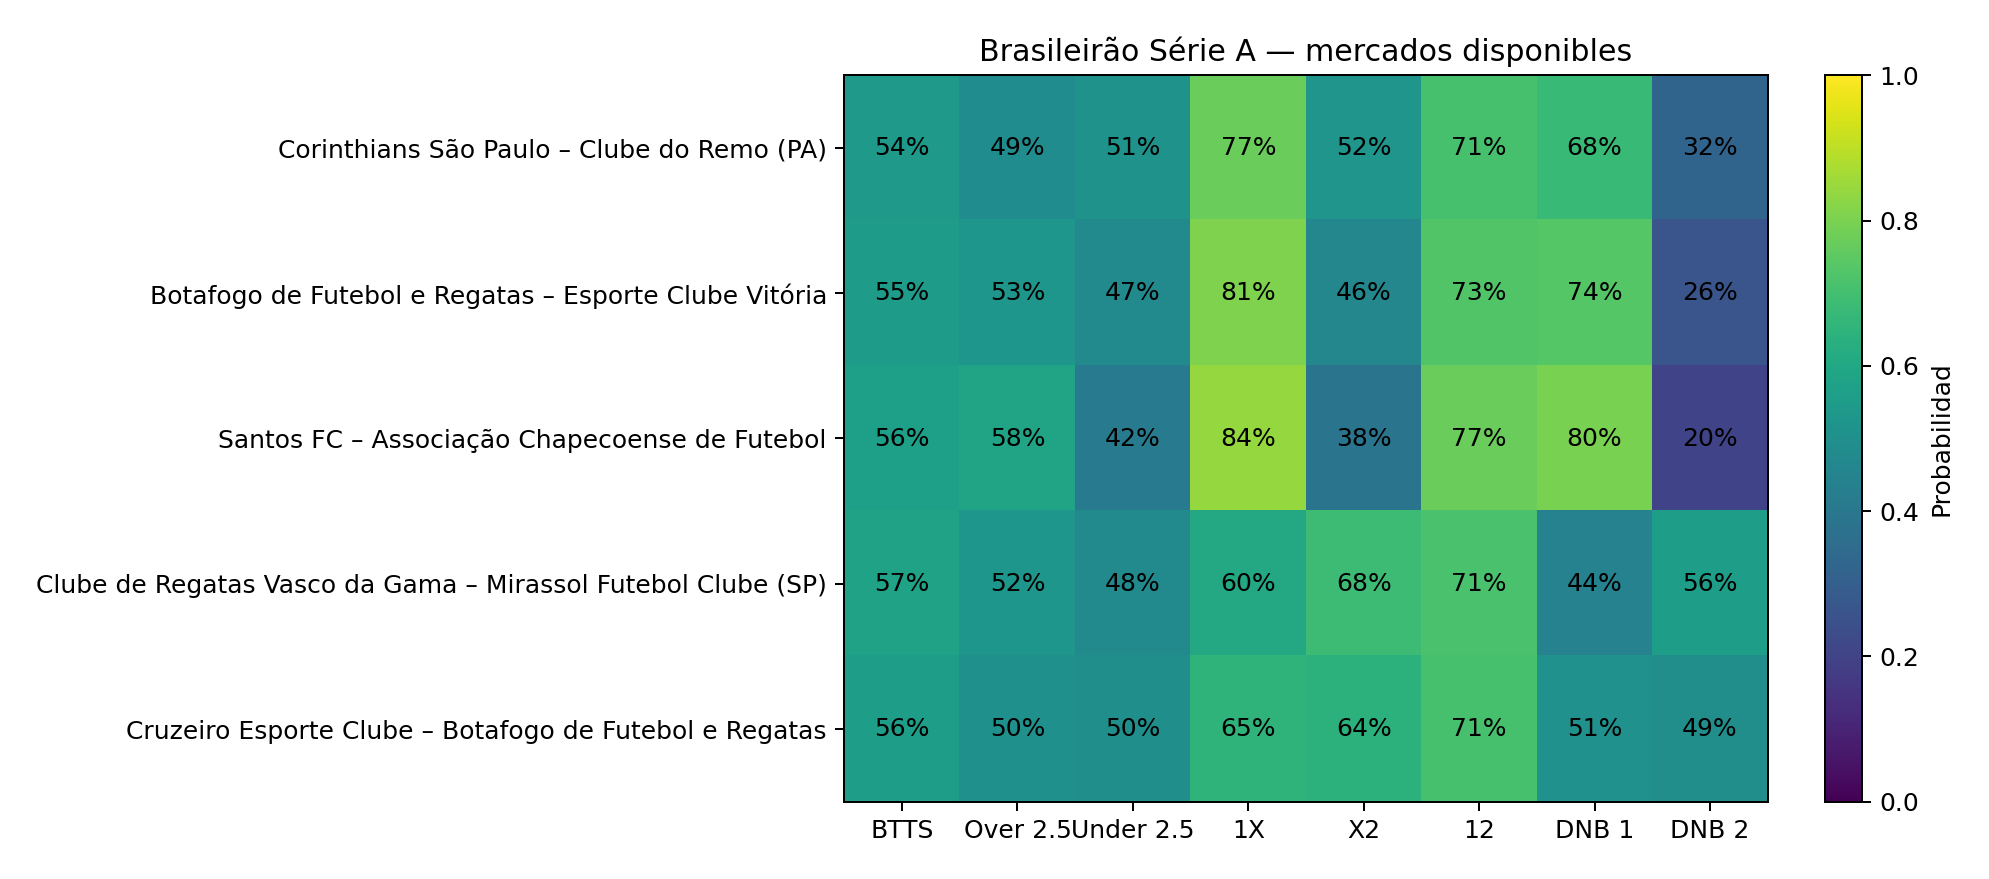
Lectura: una celda vacía significa que el mercado no se proporciona para ese partido, no que valga cero.
Historial verificado
Objetivo: seguir el acierto acumulado del pick en los partidos ya jugados.
Datos: el historial devuelto por list_league_history(), limitado a los partidos con resultado verificado.
def plot_history(league_name: str, history: list[MatchSummary]) -> plt.Figure:
    """Cumulative success curve with result and confidence."""
    decided = [match for match in history if pick_is_correct(match) is not None]
    figure, axis = plt.subplots(figsize=(12, 6))

    if not decided:
        axis.axis("off")
        axis.text(0.5, 0.5, "No verified result in the history window.", ha="center", va="center")
        return figure

    successes = 0
    cumulative = []
    for index, match in enumerate(decided, start=1):
        successes += int(pick_is_correct(match) is True)
        cumulative.append(successes / index)

    x = list(range(1, len(decided) + 1))
    axis.plot(x, cumulative, marker="o")
    axis.axhline(0.5, linestyle="--", linewidth=1)
    axis.set_ylim(0, 1)
    axis.set_xlabel("Historical match")
    axis.set_ylabel("Cumulative success rate")
    axis.set_title(
        f"{league_name} — history: {successes}/{len(decided)} correct "
        f"({cumulative[-1]:.1%})"
    )
    axis.grid(alpha=0.25)

    for index, match in enumerate(decided):
        verdict = "✓" if pick_is_correct(match) else "✗"
        axis.annotate(
            f"{verdict} {confidence_text(match)}\n{match.result_score}",
            (x[index], cumulative[index]),
            xytext=(0, 10),
            textcoords="offset points",
            ha="center",
            fontsize=8,
        )

    if len(decided) < 20:
        axis.text(0.01, 0.03, "Small sample: descriptive reading only.", transform=axis.transAxes)

    figure.tight_layout()
    return figure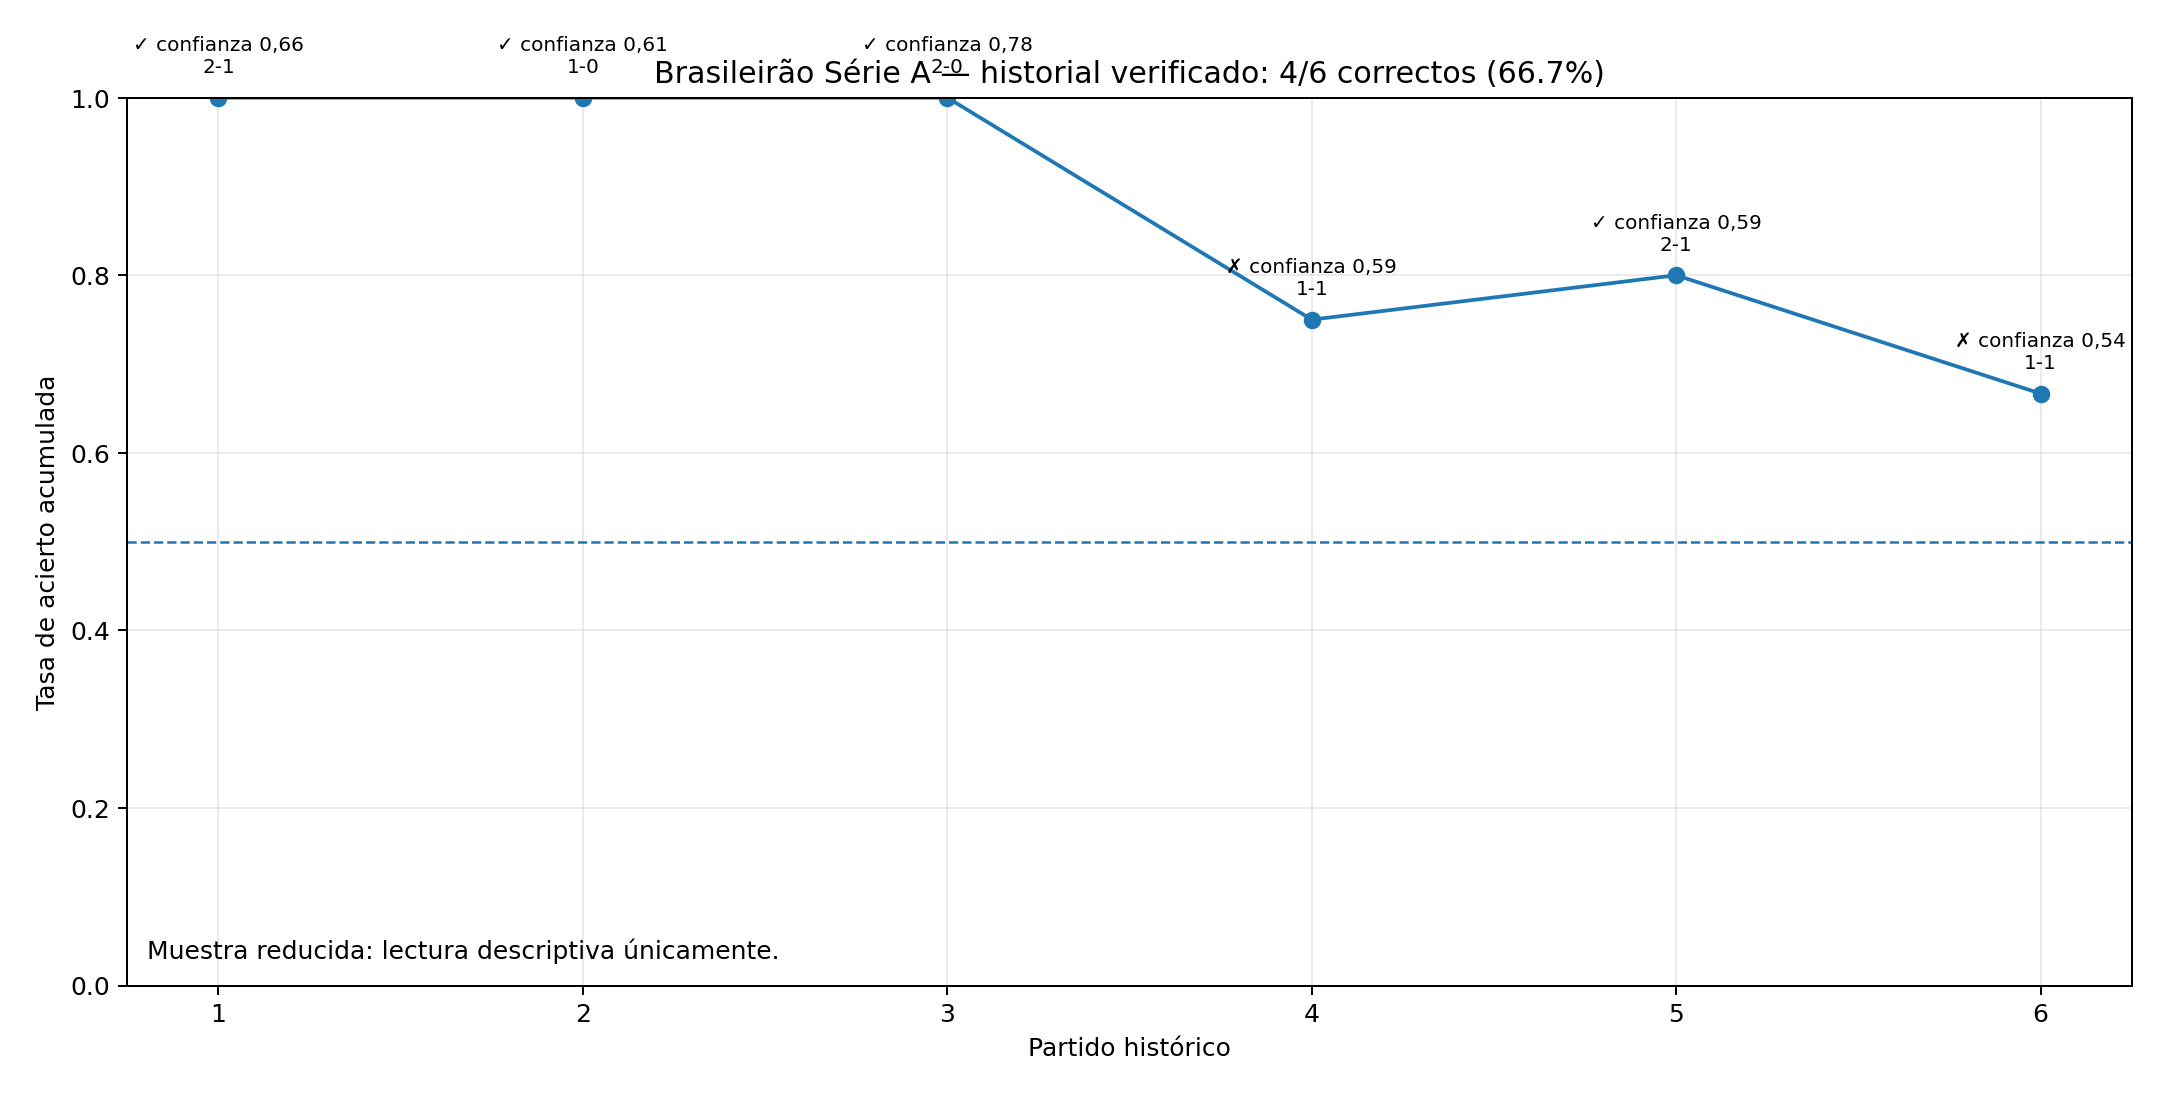
Lectura: la curva es descriptiva. En una muestra pequeña no prueba un rendimiento general.
10 Ejecutar el script
Ejecuta el script desde la carpeta que lo contiene. SAVE_PNG controla el guardado de imágenes: en True, los tres gráficos se escriben en la carpeta foresportia_charts.
python foresportia_tutorial.py11 Código completo
El bloque siguiente es el contenido íntegro del archivo canónico, idéntico al script descargable. Cópialo o descarga el .py.
Mostrar el código completo
#!/usr/bin/env python3
"""Foresportia tutorial: upcoming matches, markets and verified history.

This script is the canonical source used by the Foresportia documentation
tutorial at /api/docs/tutorials/football-dashboard.html. The page code blocks
and the downloadable file are both generated from this exact file, so they
never diverge. The ``# region`` / ``# endregion`` markers are non-functional
comments used by the documentation generator to slice out each step.

Install:
    python -m pip install --upgrade foresportia matplotlib

API key — Windows PowerShell:
    $env:FORES_API_KEY = "your_key"                          # current session
    [Environment]::SetEnvironmentVariable(
        "FORES_API_KEY", "your_key", "User"
    )                                                        # persistent

API key — macOS / Linux:
    export FORES_API_KEY="your_key"                          # current session
    echo 'export FORES_API_KEY="your_key"' >> ~/.zshrc       # macOS/zsh
    echo 'export FORES_API_KEY="your_key"' >> ~/.bashrc      # Linux/bash

To keep the main path at two API calls, also set the competition:
    $env:FORES_LEAGUE_CODE = "SUE"       # Windows PowerShell
    export FORES_LEAGUE_CODE="SUE"       # macOS / Linux

Without FORES_LEAGUE_CODE, a single-competition Developer key can be detected
with list_leagues(), at the cost of one extra request.

Run:
    python foresportia_tutorial.py
"""

from __future__ import annotations

import os
from datetime import datetime
from pathlib import Path

import matplotlib.pyplot as plt
from foresportia import ForesportiaAPIError, ForesportiaClient, ForesportiaRateLimitError
from foresportia.models import MatchSummary

LEAGUE_CODE = os.getenv("FORES_LEAGUE_CODE")
UPCOMING_DAYS = 14
UPCOMING_LIMIT = 5
SAVE_PNG = False
OUTPUT_DIR = Path("foresportia_charts")

MARKETS = (
    ("btts", "BTTS"),
    ("over_2_5", "Over 2.5"),
    ("under_2_5", "Under 2.5"),
    ("double_chance_1x", "1X"),
    ("double_chance_x2", "X2"),
    ("double_chance_12", "12"),
    ("dnb_home", "DNB 1"),
    ("dnb_away", "DNB 2"),
)


# region choose-league
def choose_league(client: ForesportiaClient) -> str:
    """Use FORES_LEAGUE_CODE or detect the only accessible competition."""
    if LEAGUE_CODE:
        return LEAGUE_CODE.upper()

    leagues = client.list_leagues().data
    if len(leagues) == 1:
        return leagues[0].code
    if not leagues:
        raise RuntimeError("No competition is accessible with this key.")

    codes = ", ".join(league.code for league in leagues)
    raise RuntimeError(
        "Several competitions are accessible. "
        f"Set FORES_LEAGUE_CODE to one of: {codes}"
    )
# endregion choose-league


# region evaluate
def actual_outcome(score: str | None) -> str | None:
    """Turn a final score such as '2-1' into home/draw/away."""
    if not score:
        return None
    try:
        home, away = map(int, score.split("-"))
    except ValueError:
        return None
    return "home" if home > away else "away" if away > home else "draw"


def pick_is_correct(match: MatchSummary) -> bool | None:
    """Compare the published 1X2 pick with the verified final score."""
    actual = actual_outcome(match.result_score) if match.is_final else None
    predicted = match.predicted_outcome
    return None if actual is None or predicted is None else actual == predicted
# endregion evaluate


def confidence_text(match: MatchSummary) -> str:
    """Show the badge when present, otherwise the confidence score."""
    confidence = match.confidence or {}
    if confidence.get("label"):
        return str(confidence["label"])
    if confidence.get("badge"):
        return str(confidence["badge"])
    score = confidence.get("score")
    return f"confidence {score:.2f}" if isinstance(score, (int, float)) else "not provided"


def date_label(match: MatchSummary) -> str:
    kickoff = match.kickoff_local or match.kickoff
    try:
        return datetime.fromisoformat(kickoff.replace("Z", "+00:00")).strftime("%d/%m")
    except (AttributeError, ValueError):
        return "--/--"


# region plot-upcoming
def plot_upcoming(league_name: str, matches: list[MatchSummary]) -> plt.Figure:
    """1X2 probabilities, main pick and confidence."""
    figure, axis = plt.subplots(figsize=(13, max(4.8, len(matches) * 0.9)))
    if not matches:
        axis.axis("off")
        axis.text(0.5, 0.5, "No upcoming published match.", ha="center", va="center")
        return figure

    y = list(range(len(matches)))
    home = [m.probabilities["home"] * 100 for m in matches]
    draw = [m.probabilities["draw"] * 100 for m in matches]
    away = [m.probabilities["away"] * 100 for m in matches]

    axis.barh(y, home, label="1 · Home")
    axis.barh(y, draw, left=home, label="X · Draw")
    axis.barh(y, away, left=[h + d for h, d in zip(home, draw)], label="2 · Away")
    axis.set_yticks(y, [f"{date_label(m)} · {m.home_team} – {m.away_team}" for m in matches])
    axis.set_xlim(0, 140)
    axis.set_xticks((0, 20, 40, 60, 80, 100))
    axis.set_xlabel("1X2 probability (%)")
    axis.set_title(f"{league_name} — upcoming matches")
    axis.grid(axis="x", alpha=0.25)
    axis.invert_yaxis()
    axis.legend(ncol=3, loc="upper center", bbox_to_anchor=(0.42, -0.12))

    for index, match in enumerate(matches):
        probability = (match.pick or {}).get("probability")
        probability_text = f"{probability:.0%}" if isinstance(probability, (int, float)) else ""
        axis.text(
            102,
            index,
            f"★ {match.predicted_outcome or 'no pick'} {probability_text} · {confidence_text(match)}",
            va="center",
            fontsize=9,
        )

    figure.tight_layout()
    return figure
# endregion plot-upcoming


# region plot-markets
def plot_markets(league_name: str, matches: list[MatchSummary]) -> plt.Figure:
    """Matrix of the markets actually present in the response."""
    available = {key for match in matches for key in (match.markets or {})}
    columns = [(key, label) for key, label in MARKETS if key in available]
    figure, axis = plt.subplots(
        figsize=(max(10, len(columns) * 1.4), max(4.8, len(matches) * 0.9))
    )

    if not matches or not columns:
        axis.axis("off")
        axis.text(0.5, 0.5, "No additional market available.", ha="center", va="center")
        return figure

    matrix = [[(m.markets or {}).get(key, float("nan")) for key, _ in columns] for m in matches]
    image = axis.imshow(matrix, aspect="auto", vmin=0, vmax=1)
    axis.set_xticks(range(len(columns)), [label for _, label in columns])
    axis.set_yticks(range(len(matches)), [f"{m.home_team} – {m.away_team}" for m in matches])
    axis.set_title(f"{league_name} — available markets")

    for row_index, row in enumerate(matrix):
        for column_index, probability in enumerate(row):
            if probability == probability:  # NaN-safe
                axis.text(column_index, row_index, f"{probability:.0%}", ha="center", va="center")

    figure.colorbar(image, ax=axis, label="Probability")
    figure.tight_layout()
    return figure
# endregion plot-markets


# region plot-history
def plot_history(league_name: str, history: list[MatchSummary]) -> plt.Figure:
    """Cumulative success curve with result and confidence."""
    decided = [match for match in history if pick_is_correct(match) is not None]
    figure, axis = plt.subplots(figsize=(12, 6))

    if not decided:
        axis.axis("off")
        axis.text(0.5, 0.5, "No verified result in the history window.", ha="center", va="center")
        return figure

    successes = 0
    cumulative = []
    for index, match in enumerate(decided, start=1):
        successes += int(pick_is_correct(match) is True)
        cumulative.append(successes / index)

    x = list(range(1, len(decided) + 1))
    axis.plot(x, cumulative, marker="o")
    axis.axhline(0.5, linestyle="--", linewidth=1)
    axis.set_ylim(0, 1)
    axis.set_xlabel("Historical match")
    axis.set_ylabel("Cumulative success rate")
    axis.set_title(
        f"{league_name} — history: {successes}/{len(decided)} correct "
        f"({cumulative[-1]:.1%})"
    )
    axis.grid(alpha=0.25)

    for index, match in enumerate(decided):
        verdict = "✓" if pick_is_correct(match) else "✗"
        axis.annotate(
            f"{verdict} {confidence_text(match)}\n{match.result_score}",
            (x[index], cumulative[index]),
            xytext=(0, 10),
            textcoords="offset points",
            ha="center",
            fontsize=8,
        )

    if len(decided) < 20:
        axis.text(0.01, 0.03, "Small sample: descriptive reading only.", transform=axis.transAxes)

    figure.tight_layout()
    return figure
# endregion plot-history


def main() -> int:
    try:
        with ForesportiaClient.from_env(timeout=20.0, max_retries=0) as client:
            league_code = choose_league(client)
            # region upcoming-call
            upcoming_response = client.list_league_matches(
                league_code,
                include="upcoming",
                days=UPCOMING_DAYS,
                limit=UPCOMING_LIMIT,
            )
            # endregion upcoming-call
            # region history-call
            history_response = client.list_league_history(league_code)
            # endregion history-call

        upcoming = upcoming_response.data[:UPCOMING_LIMIT]
        history = history_response.data
        reference = upcoming[0] if upcoming else history[0] if history else None
        league_name = f"{reference.league.name} ({reference.league.code})" if reference else league_code

        decided = [match for match in history if pick_is_correct(match) is not None]
        successes = sum(pick_is_correct(match) is True for match in decided)
        print(f"\n{league_name}")
        print(f"Upcoming matches: {len(upcoming)}")
        print(f"History received: {len(history)}")
        if decided:
            print(f"Success: {successes}/{len(decided)} ({successes / len(decided):.1%})")
        print("History window:", history_response.payload.get("date_range"))
        print("Entitlement:", history_response.history_entitlement_days, "day(s)")

        figures = [
            ("01_upcoming_1x2.png", plot_upcoming(league_name, upcoming)),
            ("02_markets.png", plot_markets(league_name, upcoming)),
            ("03_history.png", plot_history(league_name, history)),
        ]

        if SAVE_PNG:
            OUTPUT_DIR.mkdir(parents=True, exist_ok=True)
            for filename, figure in figures:
                path = OUTPUT_DIR / filename
                figure.savefig(path, dpi=170, bbox_inches="tight", pad_inches=0.2)
                print("Saved:", path.resolve())

        plt.show()
        return 0

    except ForesportiaRateLimitError as error:
        print("Temporary quota reached. Retry-After:", error.retry_after)
        return 2
    except ForesportiaAPIError as error:
        print("API error:", error.status_code, error.error_code, error.endpoint)
        return 1
    except RuntimeError as error:
        print("Error:", error)
        return 1


if __name__ == "__main__":
    raise SystemExit(main())
Crea tu clave Developer
Developer es gratuito y usa los mismos endpoints que Starter. Activa una clave, define FORES_API_KEY y vuelve a ejecutar el script.